Last updated: October 2026
Disclosure: The section on tracking the pattern uses TakeProfit‘s charting tools as a worked example; other charting platforms offer comparable drawing tools and price alerts.
Quick answer: The symmetrical triangle pattern is a neutral consolidation bounded by two converging trendlines—one connecting lower highs, one connecting higher lows. It signals indecision before a directional breakout. Confirmation requires a volume-supported close above the upper trendline (bullish) or below the lower trendline (bearish).
At a Glance
| Attribute | Detail |
|---|---|
| Type | Bilateral (continuation or reversal) |
| Signal direction | Unknown until breakout; breakouts are upward 60% of the time in Bulkowski’s sample (Bulkowski, thepatternsite.com, May 2026) |
| Where it forms | Any prior trend direction, though more often continuation |
| Typical duration | Weeks to months; less than three weeks classifies as a pennant |
| Confirmation | Close beyond a trendline with volume above the 30‑day average |
| Entry trigger | Breakout candle close or a retest of the apex area |
| Stop placement | Below the closest swing low (bullish) or above the closest swing high (bearish) |
| Target method | Height of the triangle at its widest point, projected from the breakout |
| Most common failure | Busted breakout—price moves less than 10% then reverses and closes beyond the opposite boundary |
How to Identify a Symmetrical Triangle Pattern
Use this numbered checklist:
- Prior trend — any direction is allowed. The pattern can form after a downtrend, an uptrend, or even within a sideways range (Bulkowski, thepatternsite.com, May 2026).
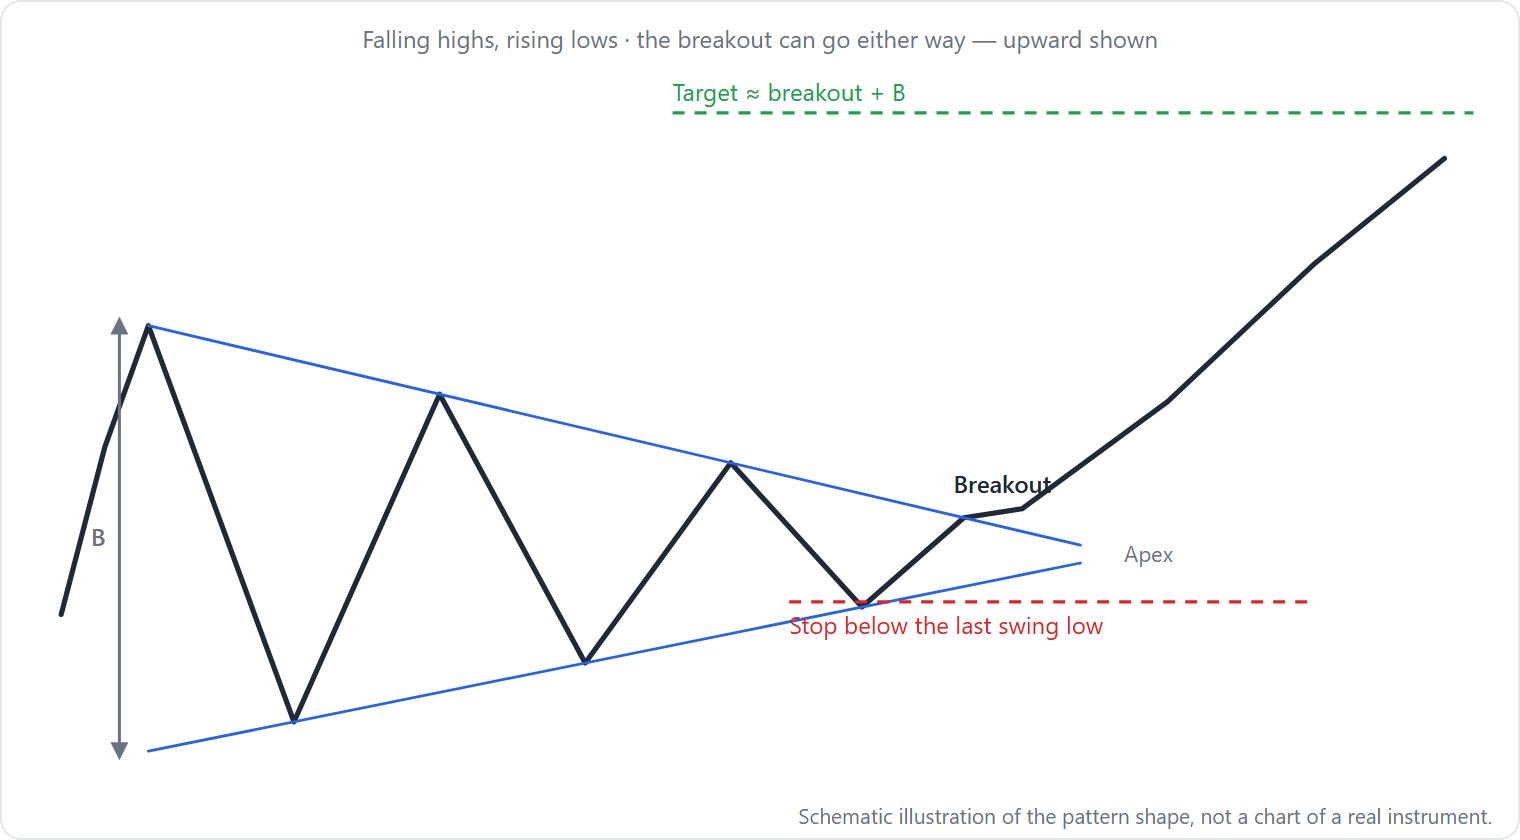
- Two converging trendlines — the upper trendline connects lower highs (sloping down), and the lower trendline connects higher lows (sloping up). These boundaries must converge toward an apex.
- Touch count — Bulkowski requires at least three touches on one trendline and two on the other, forming distinct valleys and peaks. StockCharts ChartSchool states a minimum of four reversal points across the two lines.
- Price must cross the pattern — Bulkowski emphasizes that price should “cross the pattern from side to side, filling the triangle with price movement, not white space”.
- Volume — volume trends downward during the formation 84% to 86% of the time (Bulkowski).
- Duration — typically three weeks to several months. If the pattern completes in under three weeks, it is called a pennant, a separate pattern (StockCharts ChartSchool).
- No wick/body ratio rule — no source specifies a required proportion of candle bodies to wicks for a valid symmetrical triangle.
Why the Symmetrical Triangle Forms
The pattern reflects a temporary equilibrium between buyers and sellers. Each swing low is higher (bulls step in sooner), and each swing high is lower (bears cap rallies sooner). The converging price range narrows as indecision grows, and volume declines confirm waning conviction. StockCharts ChartSchool describes it as a “period of consolidation” where neither side gains control. The eventual breakout occurs when one side exhausts or a catalyst triggers a move; because the triangle is a pause, the breakout often continues the prior trend.
How Traders Trade a Symmetrical Triangle
Entry
Wait for price to close decisively beyond a trendline. To filter false signals, use either a price filter (e.g., a close at least 3% beyond the line) or a time filter (e.g., two consecutive closes beyond the line) (StockCharts ChartSchool). Some traders prefer to enter on a retest of the breakout level, which often acts as new support or resistance.
Stop‑Loss
For a long entry, place the stop below the most recent swing low inside the triangle or below the lower trendline. For a short entry, place it above the most recent swing high or above the upper trendline.
Target – Measured Move
Compute the height of the triangle at its widest point—the difference between the highest peak and the lowest trough inside the pattern. For an upward breakout, add this height to the breakout price; for a downward breakout, subtract it. Bulkowski reports that 58% of upward breakouts meet the target (Bulkowski, thepatternsite.com, May 2026).
Worked example (illustration only):
- A stock forms a symmetrical triangle between March and June.
- The highest peak inside the triangle is $50; the lowest trough is $40.
- Height = $50 − $40 = $10.
- Price breaks out upward at $48 (close above the upper trendline).
- Measured move target = $48 + $10 = $58.
- Stop‑loss placed at $45 (below the most recent swing low inside the triangle).
- Risk = $48 − $45 = $3 per share; reward = $58 − $48 = $10 per share; ratio ≈ 3.3:1.
All prices are hypothetical; no actual trade or backtest is implied.
Volume Filter
Bulkowski notes that patterns with heavy breakout volume—above the 30‑day average—tend to perform better. ChartGuys (August 2025) suggests volume on genuine breakouts should be “at least 50% above average.”
What the Evidence Says
No peer‑reviewed academic study specifically testing symmetrical triangles was found in the gathered material. The most comprehensive empirical work comes from Thomas Bulkowski. His analysis of “over 3,000 perfect trades” on thepatternsite.com (May 2026) provides the following numbers for bull markets:
- Upward breakouts occur 60% of the time; downward 40%.
- Average rise after an up breakout: 34%; average decline after a down breakout: 12%.
- Break‑even failure rate (price fails to move beyond the breakout by even a small amount): 25% for up breakouts, 37% for down breakouts.
- Throwback (price returns to the breakout area after an up breakout): 62%. Pullback (after a down breakout): 65%.
- Percentage meeting price target: 58% for up breakouts, 36% for down breakouts.
Bulkowski ranks symmetrical triangles 36th out of 39 chart patterns for up breakouts and 34th out of 36 for down breakouts—a below‑median performer in his rankings.
Limitations: These figures come from “perfect trades”—hypothetical entries at the exact breakout price, ignoring commissions and slippage. The sample period is not specified. The data are descriptive, not predictive, and no control group exists.
When the Symmetrical Triangle Fails
Three specific failure modes:
1. Busted Pattern (Most Common)
Bulkowski defines a bust as price moving no more than 10% from the breakout, then reversing and closing beyond the opposite side of the triangle (Bulkowski, Busted Symmetrical Triangles, October 2025). For example, a downward breakout at $50 falls to $46 (only 8%), then rallies and closes above the triangle’s top. What you see: price traps traders on both sides, sometimes “double busting” if the reverse move also fails within 10%. Bulkowski reports that 48% of downward breakouts bust in bull markets.
2. Throwback/Pullback That Reverses
Even after a valid breakout, a throwback occurs 62% of the time (up breakouts) and a pullback 65% of the time (down breakouts). If the retest fails to hold, the original breakout is invalidated. What you see: price returns fully to the apex area, then re‑enters the triangle and moves in the opposite direction beyond the opposite boundary.
3. Breakout Too Close to the Apex
Breakouts near the apex (beyond the 75% point of the triangle’s width) often lack momentum. ChartGuys (August 2025) calls such breakouts “less reliable.” What you see: the breakout candle is small, volume is unimpressive, and price stalls quickly, never reaching the measured‑move target.
Look‑Alikes
| Pattern | Upper boundary | Lower boundary | Duration clue | Bias |
|---|---|---|---|---|
| Symmetrical Triangle | Slopes down | Slopes up | 3 weeks – several months | Continuation (bilateral) |
| Ascending Triangle | Flat (horizontal) | Slopes up | Similar | Bullish |
| Descending Triangle | Slopes down | Flat (horizontal) | Similar | Bearish |
| Rising Wedge | Slopes up | Slopes up | Similar | Bearish breakdown |
| Falling Wedge | Slopes down | Slopes down | Similar | Bullish breakout |
| Pennant | Two converging lines (like triangle) | Less than 3 weeks | Continuation |
For full details on ascending and descending triangles, see the sibling page on ascending/descending triangles. For rising and falling wedges, see the sibling page on wedges. Pennants (a future page) are shorter‑duration versions of the same shape.
Tracking a Symmetrical Triangle on a Chart in TakeProfit
- Draw the trendlines — Use the Standard Line tool (Alt+T) to connect the lower highs (upper trendline) and the higher lows (lower trendline). Add labels such as “Upper TL” and “Lower TL” to keep the pattern clear.
- Verify pattern width — Use the Horizontal Line tool (Alt+H) to mark the widest portion (the highest peak and lowest trough). Compute the difference; this is your height measure.
- Set alerts on the breakout level — Place a Horizontal Ray (Alt+Shift+H) at the breakout price (e.g., the upper trendline’s value at the expected time of breakout). The ray extends infinitely to the right. Set an alert on price crossing that level. For volume confirmation, monitor the volume bars below the price panel.
- Measure risk/reward — Use the Quick Measure tool (Shift+M) to calculate the distance from entry to stop and entry to target. This tool provides price change and bar count without leaving marks. Alternatively, use drawing tools to mark hypothetical levels.
- Evaluate after breakout — After a breakout, use Quick Measure (Shift+M) to confirm that a throwback stays within reasonable distance (e.g., retests no more than 50% of the initial move).
Limitation: TakeProfit does not automatically scan for symmetrical triangles. You must manually identify and draw the pattern. The platform’s Pattern tools include a Triangle tool with four control points that speeds up the drawing process.
Learn more about drawing triangle patterns in TakeProfit
FAQ
Is a symmetrical triangle bullish or bearish?
It is neutral—a bilateral pattern. The prior trend provides a bias (about 75% of triangles act as continuation patterns, per Edwards & Magee), but you must wait for the breakout.
What is the target for a symmetrical triangle pattern?
Project the height at the widest point from the breakout price. Bulkowski’s data show 58% of upward breakouts reach this target (Bulkowski, thepatternsite.com, May 2026).
How do you trade a symmetrical triangle pattern?
Wait for a volume‑confirmed close beyond a trendline (or a 3% price filter). Place a stop beyond the opposite trendline or the most recent swing low/high. Take profits at the measured‑move target or trail your stop.
What is an asymmetrical triangle?
That term usually refers to ascending or descending triangles. See the sibling page on ascending/descending triangles.
How accurate is triangle pattern trading?
No universal accuracy number exists. Bulkowski reports a 25% break‑even failure rate for upward breakouts and 37% for downward breakouts in bull markets. With volume confirmation, the odds improve.
This article is educational and is not investment advice. To get notified when price closes beyond the level you drew, see TakeProfit’s alert trigger criteria.