Last updated: October 2026
Disclosure: The section on tracking the pattern uses TakeProfit‘s charting tools as a worked example; other charting platforms offer comparable drawing tools and price alerts.
Quick answer: A pennant is a short-term continuation pattern consisting of a small symmetrical triangle that follows a steep price move (the flagpole). The breakout typically resumes the prior trend, confirmed by a close beyond one of the converging trendlines, ideally with rising volume.
Pennant pattern at a glance — Key facts
| Attribute | Detail |
|---|---|
| Type | Continuation pattern (can form after an uptrend or downtrend) |
| Signal direction | Same as the prior trend (bullish pennant after up move, bearish after down move) |
| Where it forms | After a steep, multi‑day price move (the pole) |
| Typical duration | ≤3 weeks (Bulkowski, thepatternsite.com, August 2020); 1–3 weeks (StockCharts) |
| Shape | Two converging trendlines forming a small symmetrical triangle; more horizontal than sloped (StockCharts) |
| Volume during pattern | Declines in 86% of cases (Bulkowski) |
| Confirmation | Close outside a trendline, ideally on increasing volume |
| Entry trigger | Breakout candle close (or 1‑hour close on intraday charts) |
| Stop placement | Just beyond the opposite side of the pennant (or below the most recent swing for bullish) |
| Target method | Measured move: add pole height from breakout level |
| Most common failure | False breakout that reverses back inside the pattern; measure rule works as a midpoint only about 30% of the time (Bulkowski) |
How to identify a pennant pattern — a numbered checklist
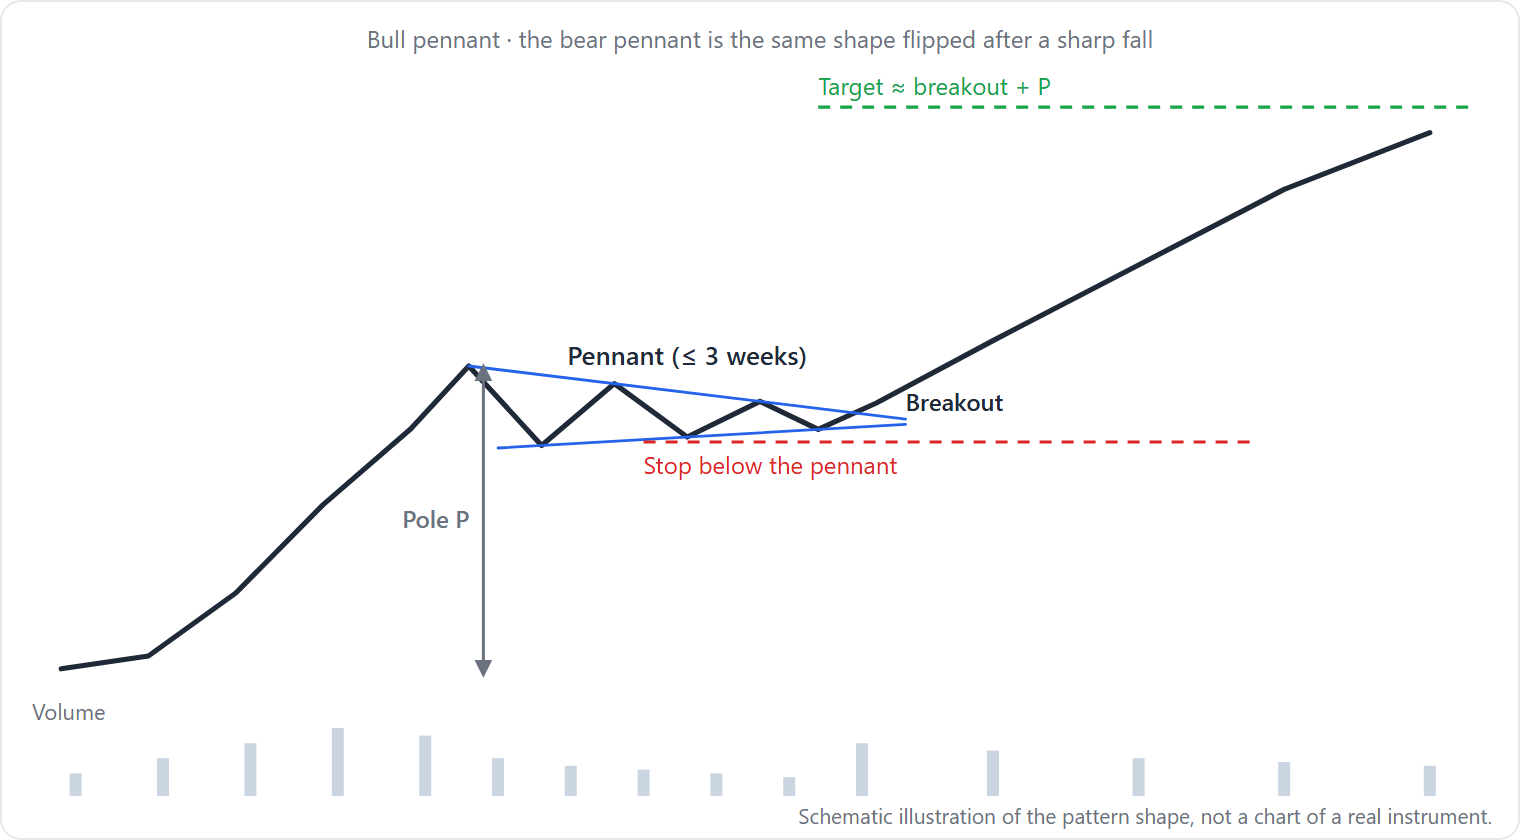
A correct identification requires five measurable criteria:
-
Prior trend (pole). The price move leading into the pennant must be “unusually steep and last several days” (Bulkowski, thepatternsite.com, August 2020). Without a clear pole, the pattern loses its structure and target. The pole should be a rapid price movement that stands out distinctly from the preceding sideways action, providing the “flagpole” from which the pennant hangs.
-
Duration. The convergence must form in 21 calendar days or fewer (Bulkowski). StockCharts says “one to three weeks.” Any consolidation lasting longer should be classified as a symmetrical triangle or wedge. On intraday charts, the same principle applies over compressed time frames—a pennant remains a short‑term pattern.
-
Shape. Draw two straight lines along the swing highs and swing lows. They must converge so the pattern resembles a small symmetrical triangle. The overall shape is more horizontal than slanted (StockCharts, “Flag, Pennant,”). The trendlines meet at a narrow angle, and the body of the pennant is roughly flat rather than tilted steeply upward or downward.
-
Volume. Trading volume should decline steadily while the pennant forms. Bulkowski’s database finds a downward volume trend 86% of the time. The typical sequence shows a volume spike on the pole, then decreasing volume during the consolidation, often reaching a low just before the breakout. A rising volume inside the pattern would contradict the pennant’s psychology.
-
Breakout. Price closes outside one of the two trendlines. In Bulkowski’s sample, upward breakouts occur 57% of the time. Confirmation improves if the breakout day shows a noticeable volume increase and the candle closes near its high (for a bullish breakout) or low (for bearish). Without such confirmation, the breakout may be premature or false.
Why the pennant forms — crowd-behavior interpretation
After a sharp directional move, traders pause to assess supply and demand. The converging price range reflects diminishing volatility as buyers and sellers temporarily balance. The convergence represents a temporary equilibrium: sellers are unable to push prices lower (in a bullish pennant) or buyers unable to push higher (in a bearish pennant). As the pattern progresses, the narrowing range indicates that one side is losing conviction. The standard narrative, offered by StockCharts and Bulkowski, is that the pennant represents a “rest before continuation”: the dominant trend participants reassert control when volume picks up at the breakout. StockCharts explicitly states that the pattern “suggests that the consolidation is just a pause before the next leg of the trend.” The eventual breakout typically occurs when the side that was pausing capitulates and the prior trend resumes.
How traders trade the pennant — entry, stop, target, and worked example
Entry. Wait for a breakout candle that closes beyond the trendline. Some traders use an additional filter, such as a 1‑hour close on intraday charts, to reduce false signals. The pattern is unconfirmed until that close. Traders may also wait for the breakout candle to close near its high (for a bullish setup) or near its low (for a bearish setup) to confirm momentum. The entry is executed on the next bar or at the close of the breakout candle.
Stop. For a bullish pennant, place the stop below the lowest price inside the pennant or below the most recent swing low. For a bearish pennant, above the highest price inside the pennant. This placement keeps the stop outside the noise of the consolidation. Bulkowski recommends placing the stop just beyond the opposite side of the pennant to avoid being stopped out by normal volatility. Some traders adjust the stop based on recent volatility, such as a multiple of average true range (ATR) below the breakout point, but the core principle is to stay clear of the pattern’s range.
Target. The measured‑move rule projects the pole’s height from the breakout level. Bulkowski (thepatternsite.com, August 2020) describes: compute the vertical distance from the start of the pole (point A) to the end of the pole (point B), then add that distance to the breakout side (point C) for a bullish target (point D). For bearish breakouts, subtract the distance from point C. This method provides a rough estimate; Bulkowski notes it works as a midpoint only about 30% of the time, so traders should consider using multiple targets or trailing stops.
Illustration with hypothetical prices:
– Stock XYZ has a pole from $50.00 (A) to $60.00 (B). Height = $10.00.
– A pennant forms. Price breaks above the upper trendline at $62.00 (C).
– Target D = $62.00 + $10.00 = $72.00.
– Place the stop at $58.50, the pennant’s lowest swing.
– Risk per share = $62.00 − $58.50 = $3.50. Reward = $10.00. Risk/reward ratio ≈ 2.9:1.
This example assumes a bullish pennant after an uptrend. Adjust the direction and arithmetic for a bearish pennant.
Pennant pattern: What the evidence says — sourced statistics
The most credible public analysis comes from Thomas Bulkowski (thepatternsite.com, August 2020), based on “more than 1,600 perfect trades” (sample period not disclosed on the page). Key figures:
– Volume declines during the pattern 86% of the time.
– Upward breakouts occur 57% of the time.
– The measured‑move rule works as a midpoint only about 30% of the time.
Bulkowski also cautions that his performance data measure the short‑term price swing, not the change from breakout to ultimate high or low. These numbers should be read as broad guideposts, not guaranteed results. Despite the large sample, the data should be considered indicative rather than predictive of future outcomes in any specific market.
When the pennant fails — three failure modes
-
False breakout. Price breaks one trendline but reverses and closes back inside the pennant within one or two bars. This happens most often in choppy, range‑bound markets where no directional conviction exists. On the chart, a false breakout appears as a small candle closing outside the trendline, often with a long upper wick (bullish false breakout) or lower wick (bearish false breakout), indicating rejection. The subsequent bar typically opens inside the pattern and continues to reverse, trapping breakout traders who entered on the initial move. The trader sees a breakout candle followed by a quick reversal below the trendline.
-
Morph into longer consolidation. The pattern exceeds three weeks without a clear breakout. Bulkowski’s classification rule says such patterns become symmetrical triangles or wedges, losing the short‑term continuation signal. Visually, the converging trendlines continue to extend beyond the three‑week limit. The price action begins to resemble a symmetrical triangle as the swings become more defined and the pattern’s slope may shift. Without a timely breakout, the pattern loses its short‑term continuation implication and may eventually break out in a direction opposite to the prior trend.
-
Pole‑less weak pattern. The preceding move lacks steepness or lasts only a day. Without a measurable pole, the pattern provides no reliable target using the measure rule and often fails to produce a sustained continuation move. The chart shows a small triangle after a shallow or sideways drift, with no clear vertical thrust. In such cases, the pattern is better classified as a symmetrical triangle, and traders should look for other setups with a visible pole.
Pennant pattern look-alikes — comparison table
| Feature | Pennant | Flag | Symmetrical Triangle | Wedge (rising/falling) |
|---|---|---|---|---|
| Trendlines | Converging (narrowing) | Parallel | Converging (narrowing) | Converging (slanted) |
| Duration | ≤3 weeks | Same | Typically >3 weeks | Same as triangle |
| Slope | Near‑horizontal | Usually opposite to trend | Horizontal | Slanted in one direction |
| Pole required | Yes | Yes | No | No |
| Volume | Drops during pattern | Drops | Drops | Drops |
| Breakout direction | Continuation of prior trend | Continuation | Either direction | Usually reversal |
The pennant is often confused with the flag, which has parallel trendlines, and the symmetrical triangle, which typically lasts longer and requires no pole. The key differentiator is the presence of a steep pole and short duration for the pennant. The table above summarizes the characteristics of each pattern for quick reference.
For more detail on flags, see the bull flag and bear flag explainer. For rising/falling wedges, refer to the wedge pattern guide. A symmetrical triangle page is planned for a future update.
Tracking a pennant on a chart in TakeProfit — practical steps
- Draw the pole. Use the Trend Angle tool or a simple Line to mark the prior sharp move from start (A) to end (B).
- Mark the pennant. Use the Line tool to draw two trendlines connecting at least two swing highs and two swing lows. Adjust the lines so they converge over a period of three weeks or fewer. Ensure the upper trendline touches the declining peaks and the lower trendline touches the rising troughs. If new price action creates additional touchpoints within the three‑week window, adjust the lines accordingly.
- Set alerts. Place a Horizontal Ray at the upper trendline (for a bullish setup) and another at the lower trendline (for a bearish setup). Set a price alert at +0.01 above or below that level. When price triggers the alert, review the chart for confirmation.
- Enter and measure risk/reward. After the breakout candle closes, use the Long/Short Tool (Alt + L) to visualize entry, stop, and target. Enter the pole‑based target from the measure rule. The tool displays the risk/reward ratio in real time.
Limitation: TakeProfit does not automatically detect pennants; no “pennant” tool exists. You must manually draw and update trendlines. The platform offers pattern tools for harmonic patterns and triangles, but not specifically for pennants.
Pennant pattern FAQ — from real search queries
Is a pennant pattern bullish or bearish?
It can be either. A bullish pennant appears after an uptrend and signals continuation upward; a bearish pennant after a downtrend signals continuation downward. The pattern itself does not dictate direction.
What is the difference between a flag and a pennant?
Flags have parallel trendlines; pennants have converging trendlines. Both require a steep pole and short duration (≤3 weeks).
How do you draw a pennant on a chart?
After a sharp price move, draw two trendlines connecting at least two swing highs and two swing lows so that they converge. Ensure the consolidation lasts three weeks or less and volume declines inside.
What is the 3‑5‑7 rule in trading?
This rule is not pennant‑specific. It refers to general time‑price symmetry and is not part of standard pennant pattern literature.
What does a pennant look like?
A small symmetrical triangle preceded by a steep vertical “flagpole.” It resembles a pennant on a flagpole.
This article is for educational purposes and does not constitute investment advice; past performance does not guarantee future results; trade at your own risk.
Learn more about setting alerts on trendline breakouts in the TakeProfit docs.