Last updated: September 2026
Disclosure: The section on tracking the pattern uses TakeProfit’s charting tools as a worked example; other charting platforms offer comparable drawing tools and price alerts.
Quick answer: A rising wedge and a falling wedge are chart patterns bounded by two converging trend lines that slope in the same direction. A rising wedge slopes up and usually resolves down; a falling wedge slopes down and usually resolves up. In Thomas Bulkowski’s studies, rising wedges broke down 60% of the time and falling wedges broke up 68% of the time.
Methodology note (applies throughout): Bulkowski’s public reference pages do not publish the sample date ranges. His counts refer to “perfect trades,” his term for patterns that met his identification rules and were evaluated under his testing framework; full methodology and periods are not published on the pages cited.
At a glance
| Attribute | Detail |
|---|---|
| Type | Rising wedge: classically bearish; falling wedge: classically bullish. Both can act as reversal or continuation patterns in price action. See StockCharts ChartSchool for rising wedge and falling wedge. |
| Signal direction | Bulkowski (US stocks): rising wedges break downward ~60%; falling wedges break upward ~68%. See his rising and falling wedge pages. |
| Where it forms (trend context) | Either can appear after uptrends or downtrends. Classical texts tie reversal use to established prior trends; Bulkowski allows any prior trend direction. |
| Typical duration or timeframe | Classical guidance: often 3–6 months. Bulkowski’s minimum: 3 weeks; shorter structures are pennants. |
| Confirmation | Wait for a decisive close outside a wedge boundary (Bulkowski). Many practitioners also require a break of the prior reaction high/low for extra confirmation (ChartSchool). |
| Entry trigger | Rising wedge: consider a short on a close below support. Falling wedge: consider a long on a close above resistance. A retest of the broken trend line is common (ChartSchool). |
| Stop placement | Common rule of thumb: place a stop loss beyond the last internal swing (short above the last swing high in a rising wedge; long below the last swing low in a falling wedge), per Investopedia’s rising‑wedge trading guide. Allow room for throwback/pullback risk, which reduces performance (Bulkowski). |
| Target method | Classical measured move: project the wedge’s base height from the breakout (Investopedia). Bulkowski targeting: after a breakdown from a rising wedge, target the lowest internal valley; after an upside break from a falling wedge, target the highest internal peak. He also provides a “measure rule” that scales height by the percentage of patterns that meet target on his pages. |
| Most common failure | False break followed by a fast throwback/pullback. Bulkowski reports these are frequent and impair results. ChartSchool emphasizes volume confirmation for falling‑wedge breakouts. |
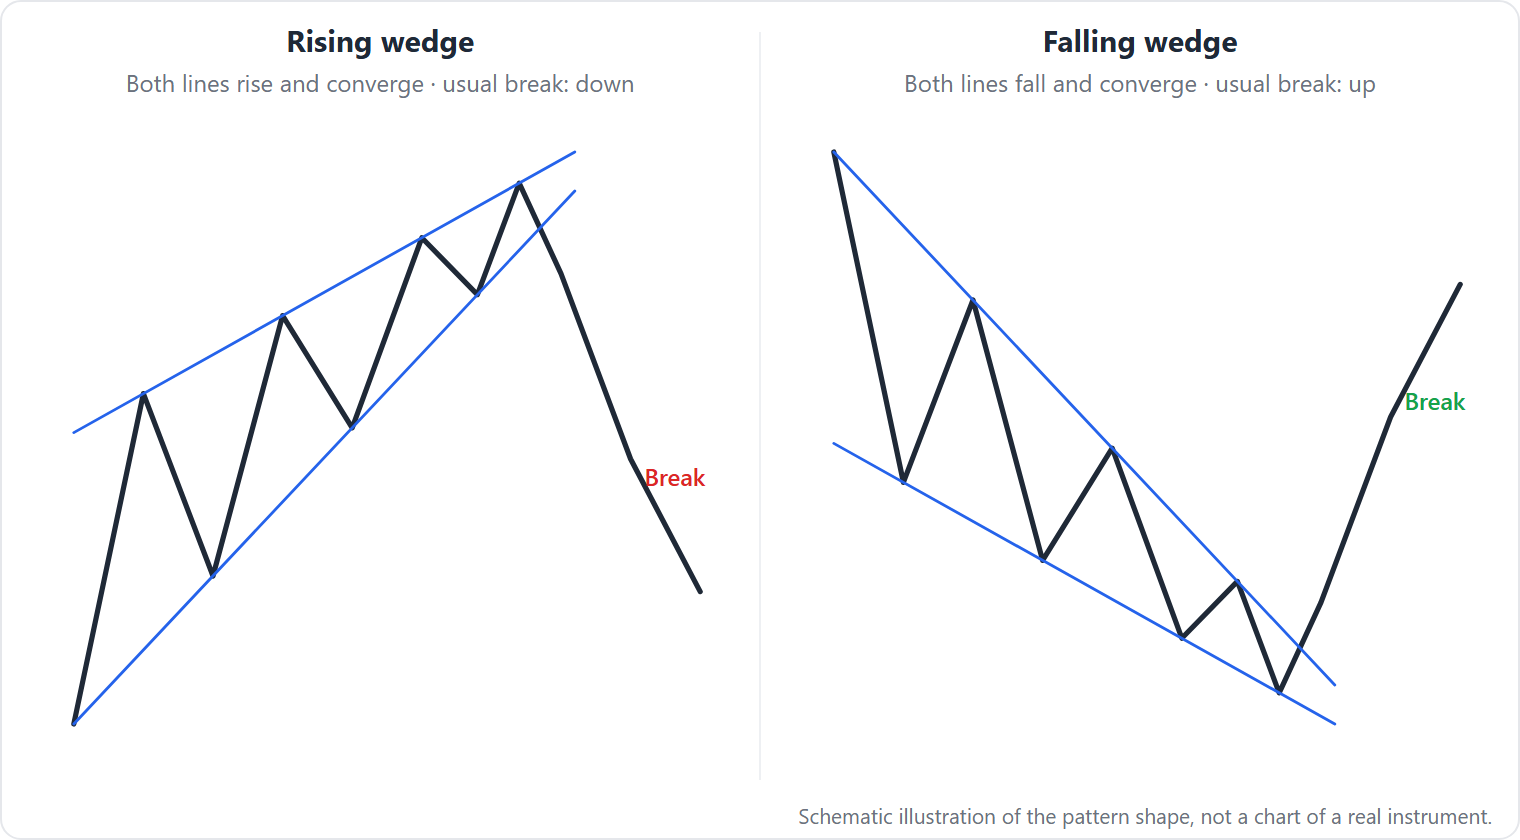
How to identify rising and falling wedge patterns
A wedge is identified by two converging trend lines that slope in the same direction and constrain a narrowing range as price swings consolidate.
- Converging, same‑slope trend lines
- Rising wedge: both lines slope upward, with the lower line steeper than the upper (Investopedia; ChartSchool).
-
Falling wedge: both lines slope downward, with the upper line steeper than the lower (ChartSchool).
-
Touches
-
Bulkowski’s guideline for a “good” pattern is at least five touches total (3 on one line, 2 on the other) in his US‑stock work.
-
Contraction and apex timing
- Rising wedge: Bulkowski reports upward breakouts occur, on average, about 67% of the distance to the apex (where the lines would meet).
-
Falling wedge: he reports breakouts occur roughly 61–62% of the way to the apex.
-
Volume behavior
- Rising wedge: volume trends down in about 79% of cases (Bulkowski).
-
Falling wedge: ChartSchool prefers expansion on the upside break; Bulkowski observes volume tends to decline into the break.
-
Duration
- Bulkowski’s minimum is 3 weeks; shorter look‑alikes are treated as pennants.
-
Classical references often cite 3–6 months.
-
Confirmation
- Trade only after a close outside the boundary (Bulkowski). ChartSchool adds that breaking the prior reaction high/low strengthens the signal.
Where sources differ: duration (3 weeks vs 3–6 months), volume’s role (Bulkowski’s tendency vs ChartSchool’s emphasis for falling wedges), and prior‑trend strictness (ChartSchool prefers established trends; Bulkowski allows any).
Why these patterns form
Rising and falling wedge patterns are often interpreted as momentum fading within a trend. A rising wedge shows higher highs and higher lows with diminishing thrust; a falling wedge shows lower highs and lower lows with waning pressure. These crowd‑behavior narratives are interpretations, not proofs (Investopedia; ChartSchool).
Bulkowski’s large‑sample work shows both formations can break either way, and many moves are modest or fail to follow through (US stocks).
How traders trade these patterns
Most trading strategies wait for confirmation: a close beyond the relevant trend line, sometimes plus a break of the prior reaction point and, for bullish setups, volume expansion.
- Entries
- Rising wedge: consider shorting on a close below the lower line; some also wait for a close below the prior swing low (ChartSchool). Bulkowski emphasizes waiting for the close outside.
-
Falling wedge: consider buying on a close above the upper line. ChartSchool prefers volume expansion and accepts a post‑break retest.
-
Stops
- Common convention is just beyond the last internal swing: short stops just above the last swing high in a rising wedge; long stops just below the last swing low in a falling wedge (Investopedia — rising‑wedge trading).
-
Allow for retests: throwbacks/pullbacks are frequent and can hurt performance (Bulkowski).
-
Targets
- Classical measured move: take the height at the base and project it from the breakout (Investopedia).
-
Bulkowski targeting (definitions and formula): after a breakdown from a rising wedge, use the lowest internal valley (the lowest swing low inside the pattern) as a baseline target. After an upside break from a falling wedge, use the highest internal peak (the highest swing high inside the pattern). Alternatively, compute height = highest peak − lowest valley inside the wedge, multiply by the “percentage meeting price target” published on his page, and add/subtract that result to/from the breakout price to set a probabilistic target (Bulkowski).
-
Managing retests
- Some traders scale in on a retest of the break level. Stops are placed to survive a normal retest yet still define risk tightly (ChartSchool).
Worked examples:
– Falling‑wedge long (hypothetical)
– Structure: top trend line near $50; bottom near $44 at the base.
– Break: daily close at $48.20 above the upper line (confirmation).
– Entry: Long at $48.20. Stop: below the last swing low, say $45.40.
– Classical target: height ≈ $6 projected from the break → $54.20.
– Risk/reward ≈ ($6.00 gain) / ($2.80 risk) ≈ 2.14:1.
- Rising‑wedge short (hypothetical)
- Structure: upper trend line near $82; lower near $76 at the base.
- Break: daily close at $75.40 below the lower line (confirmation).
- Entry: Short at $75.40. Stop loss: just above the last swing high inside the pattern, say $78.10.
- Classical target: height ≈ $6 projected down → $69.40.
- Risk/reward ≈ ($6.00 gain) / ($2.70 risk) ≈ 2.22:1.
- Note: a throwback to ~$76 after the break is common. Position sizing should assume a potential retest.
What the evidence says
Bulkowski’s US‑stock samples show directional biases but uneven performance.
-
Rising wedge: Breakouts can go either way; downward occurs about 60%. He reports declining volume during formation in ~79%, frequent throwbacks/pullbacks, and that downside breakouts rank among the weakest bearish trading strategies with small average declines (US stocks; see his rising‑wedge page, as of September 2026). StrefaTradingu summarizes the weak bearish performance and notes stronger upside moves when they occur (secondary source).
-
Falling wedge: Upward breakouts are about 68%. Volume typically trends down during formation, and tall patterns and strong breakout‑day volume/gaps tend to do better (US stocks; see his falling‑wedge page, as of September 2026).
Limits and criticism: These are not peer‑reviewed academic results and the cited pages do not publish sample periods or transaction costs. Method details are proprietary; independent replication is encouraged (Bulkowski; StrefaTradingu).
When these patterns fail
Rising and falling wedges fail in repeatable ways: quick reversals, retests that whipsaw, and “busted” breaks that reverse through the opposite side.
- False breakout and re‑entry
- Trigger: a close beyond a boundary that quickly reverses.
-
Chart tell: first a confirmed close outside the line. Next, an immediate close back inside within a few bars. This is more common when volume does not confirm, especially for falling‑wedge breakouts where ChartSchool prefers expanding volume.
-
Throwback/pullback that trips stops
- Trigger: a post‑break retest of the broken line.
-
Chart tell: after a breakdown from a rising wedge, price rallies to “kiss” the underside of the lower line, then rolls over. After an upside break from a falling wedge, price often corrects to test the upper line from above. These retests are common and reduce performance (Bulkowski; ChartSchool).
-
“Busted” breaks that reverse through the opposite side
- Trigger: the initial breakout travels only a short distance, then pivots and exits through the other side.
-
Chart tell: a rising wedge breaks down, dips briefly, then surges above the top. Bulkowski treats “busted” rising wedges separately and outlines a potential long setup once price exceeds the top (see his busted rising‑wedge discussion, as of September 2026). For falling wedges, he describes a post‑downward‑break “curl around the front” that then soars upward.
-
Regime mismatch
- Trigger: the broader market trend overwhelms the pattern’s bias.
- Chart tell: bullish‑bias falling wedges breaking down during strong bear phases; variation performance differs with context in Bulkowski’s notes.
Look‑alikes: telling wedges from other patterns
Two tests separate look‑alikes: do both sides slope and do they converge?
| Pattern | How it differs | Where to read more |
|---|---|---|
| Ascending/descending triangle | One side is flat, the other sloped; wedges have both sides sloped and converging. Triangles also lack a slope‑based bias. | See our explainer: Ascending and Descending Triangle |
| Bull flag / bear flag (channels) | Two parallel lines (no convergence). Usually shorter‑term continuation after a sharp move; wedges converge and often last longer. | See: Bull Flag and Bear Flag |
| Symmetrical triangle | Two converging lines with little or no net slope; wedges have a clear up or down slope. | Brief distinction here; full guide planned (no link) |
| Ascending broadening wedge | Both sides slope up but diverge into a megaphone; volume often expands. Do not confuse with a converging rising wedge (see Bulkowski’s ascending broadening wedge, as of September 2026). | Bulkowski’s page |
| Head and Shoulders | A reversal pattern with horizontal neckline support and resistance rather than converging trend lines. | See: Head and Shoulders |
Tracking wedges on a chart in TakeProfit
TakeProfit (platform): how to document and plan a wedge trade, neutrally.
- Draw the formation
-
Use two manual trend lines to mark the upper and lower boundaries. Count at least 3+2 touches and note how far price travels toward the apex before the price breaks.
-
Measure and plan
-
Use Quick Measure and Date & Price to read base height, percentage moves, and time length. Use the Long‑Short Tool to plan a confirmed‑close entry, stops beyond the last internal swing, and targets via height projection or internal peak/valley. See TakeProfit docs: measurement tools (Long‑Short Tool, Quick Measure, Date & Price, Fixed Range Volume Profile, Anchored VWAP): TakeProfit docs: measurement tools.
-
Volume context
- Fixed Range Volume Profile helps compare participation across the body of the pattern and around the break level relative to ChartSchool’s guidance for falling‑wedge confirmation. For tool specifics, see TakeProfit docs: pattern tools.
Limitation (explicit): TakeProfit’s tools are planners only; nothing is sent to an exchange. The docs cited do not describe automatic wedge recognition or screening; you draw wedges by hand and any alert must watch a price level you set, not a detected pattern.
FAQ
- Is a rising wedge ever bullish?
-
Yes. Bulkowski reports rising‑wedge breakouts go upward a substantial minority of the time and some of those moves trend strongly. Always wait for a confirmed close (StrefaTradingu summarizing Bulkowski; see Bulkowski’s rising‑wedge page).
-
Is a falling wedge pattern bullish?
-
Classically yes: both lines slope down and converge, and a break above resistance on strong volume is the buy trigger (ChartSchool). Always wait for a close.
-
What is the opposite of a falling wedge pattern?
-
A rising wedge: both lines slope up and converge, with a classical bearish bias (Investopedia).
-
Are these patterns reversal or continuation?
-
Both. Rising wedges can reverse uptrends or continue downtrends; falling wedges can reverse downtrends or continue uptrends. The slope‑based bias stays the same (Investopedia; ChartSchool).
-
What is the success rate of a falling wedge?
- Bulkowski’s US‑stock study reports that falling wedges break upward about 68%. Treat this as a directional breakout bias, not a guaranteed win/loss rate; manage risk with a stop loss and confirmation rules (see his falling‑wedge page, as of September 2026).
Educational use only; not investment advice.
To get notified when price closes beyond the level you drew, see TakeProfit’s alert trigger criteria.