Last updated: September 25, 2026
Disclosure: The section on tracking the pattern uses TakeProfit’s charting tools as a worked example; other charting platforms offer comparable drawing tools and price alerts.
Quick answer: The head and shoulders pattern is a three‑swing reversal: a higher middle peak (the head) between two lower shoulders for a top, or the mirror image for a bottom. Confirm on a decisive close beyond the neckline; if the neckline slopes against the move, confirm by a close beyond the right armpit per Bulkowski.
At a glance
| Attribute | Detail |
|---|---|
| Type | Reversal: a standard head and shoulders top is bearish; its mirror image (head and shoulders bottom) is bullish. IG Academy |
| Signal direction | Top: downward after confirmation; Bottom: upward after confirmation (IG Academy). |
| Where it forms | Top: after an uptrend; Bottom: after a downtrend. StockCharts ChartSchool |
| Typical duration/timeframe | Often multi‑week to months on daily/weekly charts in classical technical analysis; academic tests evaluate daily data (1962–1996). NBER: Lo–Mamaysky–Wang; IG Academy (inverse) |
| Confirmation | Close beyond the break line; if that line slopes against the breakout, confirm by a close beyond the right armpit (Bulkowski). StockCharts Mailbag; ThePatternSite |
| Entry trigger | After a confirmation close; some traders wait for a retest that holds. IG Academy; Mitrade |
| Stop placement | Commonly beyond the right shoulder; some use the head for wider invalidation. Mitrade |
| Target method | Measured move: vertical distance from head to the break line, projected from the breakout area. StockCharts ChartSchool (bottom) |
| Common failures | Intrabar pierces without a confirming close; throwbacks/pullbacks can degrade results. ThePatternSite |
How to identify the head and shoulders pattern
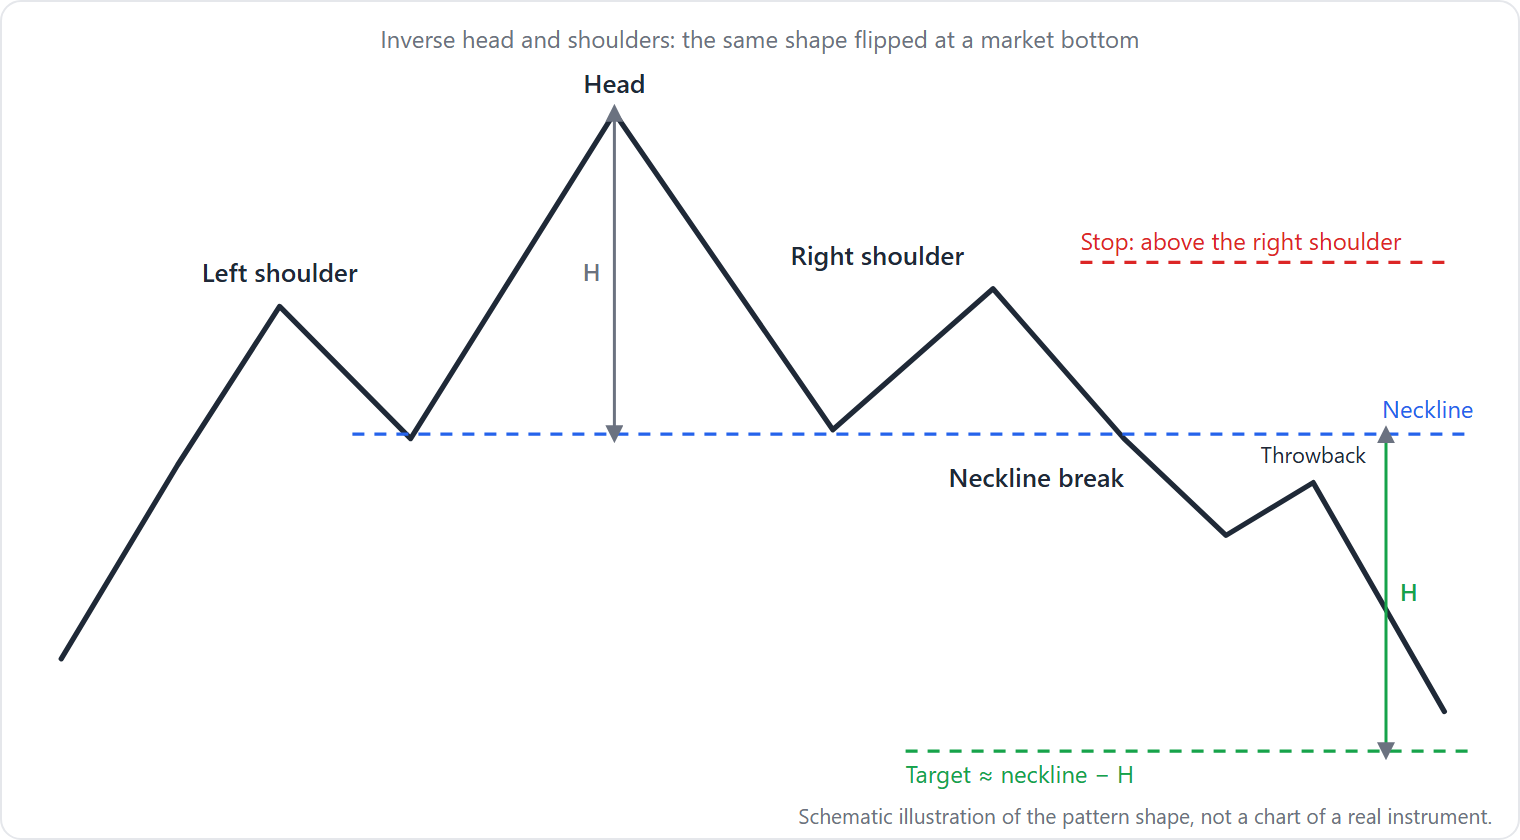
In technical analysis, the head and shoulders is three swings with a dominant head and a line through the two intervening reaction points. That line acts as support (top) or resistance (bottom), and a decisive close beyond it confirms a potential reversal. See IG Academy.
Use this checklist:
1) Prior trend
– Top: follows an uptrend; Bottom: follows a downtrend. Without a preceding move, there is nothing to reverse. StockCharts ChartSchool
2) Structure and symmetry
– Three peaks for a top (middle highest) or three troughs for a bottom (middle lowest). Shoulders sit below (top) or above (bottom) the head (IG Academy).
– A proportional look is preferred: shoulders near the same price and roughly equidistant from the head. Bulkowski notes it should not look lopsided. ThePatternSite.
– Shoulders need not be identical; formal texts allow asymmetry provided both are below (top) or above (bottom) the head. CMT Association Level I (Kirkpatrick & Dahlquist).
3) Neckline (break line)
– Draw it through the two “armpits”: the reaction lows (top) or highs (bottom). It may slope up, down, or be flat.
4) Volume tendency (quality filter)
– Often highest on the left shoulder, trending lower into the right shoulder, and expanding on the break. StockCharts Mailbag; IG Academy
– Bulkowski reports declining volume across tops 61% of the time from a large sample of “perfect trades.” ThePatternSite.
5) Confirmation: slope‑specific rule
– Completion requires a decisive close beyond the break line. If that line slopes against the breakout, use a close beyond the right armpit instead (Bulkowski). ThePatternSite
6) Measured move available
– The head‑to‑line height sets an objective when projected from the break point. StockCharts ChartSchool (bottom)
Note: A two‑peak “M” without a dominant head is a different potential reversal; see Double Top and Double Bottom.
Why the head and shoulders pattern forms
The pattern shows a shift from higher highs/lows to a support break (or the mirror image at bottoms), reflecting changing supply and demand and price action dynamics. See StockCharts Mailbag.
Classically, trading volume peaks early and wanes into the right shoulder; the break signals sellers (or buyers in the bottom) taking control. StockCharts “Shampooing the Market”; IG Academy.
The volume‑and‑psychology story is an interpretation, not a mechanism. Academic work finds incremental information in this technical indicator category without assigning psychological causality. See NBER’s Lo–Mamaysky–Wang.
How traders trade the head and shoulders pattern
Traders often treat the head‑and‑shoulders pattern as a rules‑based trading strategy: wait for confirmation, set a structural stop, and use a measured target. StockCharts ChartSchool (bottom); ThePatternSite.
- Entry
- Aggressive: enter on the first close beyond the break line. IG Academy
- Conservative: wait for a retest that rejects the level. Mitrade
-
For sloped lines, apply Bulkowski’s close rule (e.g., for a top with a downward‑sloping line, confirm by a close below the right armpit). ThePatternSite
-
Stop
-
Often beyond the right shoulder high (short) or low (long); wider invalidation at the head is possible but increases risk (per Mitrade, accessed Sep 2026).
-
Target
- Measured move: measure vertically from head to the line directly below/above it; project that distance from the breakout area. StockCharts ChartSchool (bottom)
Illustration (hypothetical, not a backtest):
– Setup: A bearish head and shoulders. Head high = 110. Line value directly below head = 100. Height = 10.
– Confirmation: Downward‑sloping line; confirm on a close below the right armpit (Bulkowski). ThePatternSite
– Entry: Short at 98 after the confirming close.
– Target: Project height from the break: 98 − 10 = 88.
– Stop: Above the right shoulder at 104 (stop anchored to the right shoulder per Mitrade; price is illustrative).
– Risk/Reward: Risk = 104 − 98 = 6. Reward = 98 − 88 = 10. R:R ≈ 1.67.
What the evidence says
Empirical sources agree on close‑based confirmation and measured targets; they differ on symmetry strictness and performance across markets and time. CMT Association Level I; StockCharts Mailbag.
Bulkowski’s core figures (daily U.S. equities samples, largely pre‑2008 high‑frequency era) and one academic reference:
| Pattern | Sample | Break‑even failure | Average move | Throwback rate | Target met |
|---|---|---|---|---|---|
| Inverse (bottom) | 3,197 “perfect trades” | 11% | +45% | 65% | 71% |
| Top | >2,800 “perfect trades” | 19% | −16% | 68% | 51% |
| Academic (H&S indicative value) | U.S. stocks, 1962–1996 | not applicable | not applicable | not applicable | not applicable |
Sources: ThePatternSite bottoms page (sample/statistics) and tops page (sample and statistics); NBER Lo–Mamaysky–Wang. Note: Titan FX summarizes Bulkowski’s work as primarily 1991–2005 daily data and cautions that intraday noise and post‑2008 algorithmic microstructure can alter observed rates; apply caution across time and markets. See Titan FX research summary.
Best used on: daily/weekly equities where noise is lower; expect more false signals on sub‑hour intraday charts and in very volatile or crypto markets (apply strict confirmation and risk controls).
Many retail guides show intraday examples, but classical examples emphasize daily/weekly charts; noise on very low timeframes can degrade results. IG Academy; Titan FX research summary.
When the head and shoulders pattern fails
Head‑and‑shoulders formations can fail by breaking prematurely, retracing after confirmation, or forming in poor contexts.
- False break without a confirming close
- Trigger: Intrabar pierce reverses by the close.
-
What you see: A wick through support/resistance, but the bar closes back within the shoulder structure; no confirmation (StockCharts Mailbag).
-
Throwback/pullback that degrades performance
- Trigger: After a valid break, price retests the level and stalls or reenters the structure.
-
What you see: A return to the break line (throwback/pullback); Bulkowski records high throwback rates and weaker outcomes when they occur. ThePatternSite
-
Sloppy, multi‑peak lead‑ins
- Trigger: “Loose‑looking” swings or multiple mini‑peaks before/within the pattern.
-
What you see: Shoulders at mismatched levels, choppy armpits; Bulkowski cautions on weaker performance in messy contexts. ThePatternSite
-
Tall breakout bar that retraces
- Trigger: Oversized one‑day move lacking follow‑through.
-
What you see: A long bar through the level followed by quick retracement; flagged as prone to failure in bottoms. ThePatternSite
-
Insufficient prior trend
- Trigger: Formation after a small, slow advance/decline—little to reverse.
- What you see: A textbook shape but limited follow‑through after confirmation. ThePatternSite
If a two‑peak structure appears instead, consider whether a Double Top/Bottom better fits.
Look‑alikes: quick distinctions
| Pattern | How it differs | Where to read more |
|---|---|---|
| Double Top/Bottom | Two peaks/troughs (no distinct head); often forms faster than an H&S. | Double Top and Double Bottom |
| Triple Top/Bottom | Three peaks/troughs, but the middle is not meaningfully above/below the others; no dominant head. | not published |
| Rising Wedge | Higher highs and higher lows within converging trendlines; reversal confirmed on a trendline break, not a neckline. | Rising Wedge and Falling Wedge |
Tracking the pattern on a chart in TakeProfit
TakeProfit’s chart widget provides manual drawing and measurement tools for this pattern. This section maps those tools to the steps above.
- Draw and label
- Place the left shoulder, head, and right shoulder, then draw the break line through the two armpits. See the in‑platform Pattern tools guide for drawing basics.
-
Use Line tools to mark your planned confirmation level and a stop beyond the right shoulder. See the in‑platform Pattern tools guide.
-
Measure targets and plan risk
- Use the Measurement tools to gauge the vertical head‑to‑line distance and project a target from the breakout.
- Use the Long‑Short Tool to visualize entry and exit points, stop, and the measured target.
Limitations:
– No automatic pattern recognition; you draw it by hand.
– The Long‑Short Tool is a planner, not an order ticket; you still place orders manually via your broker or integration.
– Price alerts track the level you set; they do not infer or verify the pattern automatically.
FAQ
- Is the head and shoulders bullish or bearish?
-
A bearish head and shoulders marks a potential reversal after an advance; the head and shoulders bottom is bullish after a decline. Confirmation requires a close beyond the break level (IG Academy).
-
What usually happens after a head and shoulders pattern?
-
After confirmation, traders look for a trend reversal and often use a head‑to‑line measured move for an initial target. StockCharts ChartSchool (bottom)
-
How do you measure a head and shoulders pattern?
-
Measure the vertical distance from the head to the line directly below/above it, then project that distance from where price breaks out. IG Academy (inverse)
-
What confirms a head and shoulders pattern?
-
A decisive close beyond the break line. If that line slopes against the move, confirm with a close beyond the right armpit (Bulkowski). ThePatternSite
-
Is it useful on intraday charts?
-
Classical usage emphasizes daily/weekly charts; very low timeframes can be noisy, reducing effectiveness. NBER (Lo–Mamaysky–Wang)
-
Does the pattern work in forex or crypto?
- The structure appears across markets, including forex trading and cryptocurrencies, but most published evidence is from equities on daily data. Expect more noise intraday and in highly volatile instruments; apply strict confirmation and risk controls. Titan FX research summary
This article is educational and is not investment advice.
Learn more in TakeProfit docs: Alert trigger criteria (how alerts fire and notify) — TakeProfit docs: alert trigger criteria