Last updated: September 2026
Disclosure: The section on tracking the pattern uses TakeProfit’s charting tools as a worked example; other charting platforms offer comparable drawing tools and price alerts.
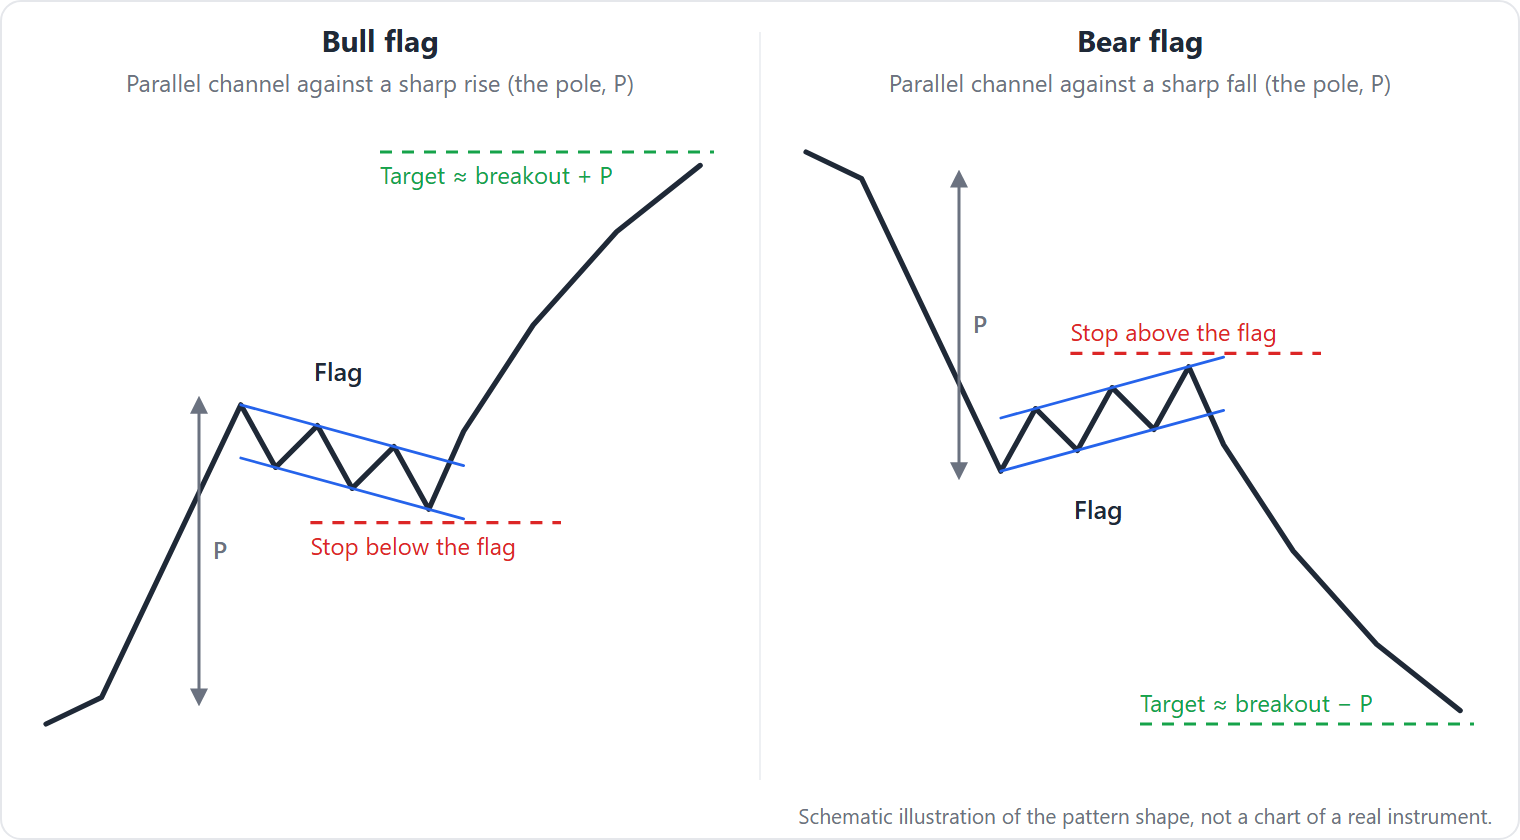
Quick answer: The bull flag and bear flag pattern is a short-term continuation setup: a sharp flagpole advance or decline, then a brief, parallel channel that typically tilts against the prior move. Bull flags slope down in uptrends; bear flags slope up in downtrends. Continuation is signaled only by a breakout with rising volume, per Investopedia.
At a glance
| Attribute | Detail |
|---|---|
| Type | Continuation chart pattern in classical technical analysis (StockCharts ChartSchool: Flags and Pennants). |
| Signal direction | Bull flag → potential upward continuation; bear flag → potential downward continuation (Investopedia). |
| Where it forms | After a sharp move (“flagpole”) inside an existing trend; without a steep pole, it is not a flag (ChartSchool; Bulkowski, ThePatternSite). |
| Typical duration / timeframe | Short. Conventions vary: about 5–20 bars (Investopedia); less than 3 weeks (Bulkowski); 1–12 weeks with debate beyond ~8 weeks and reclassification as rectangles beyond 12 weeks (ChartSchool). |
| Confirmation | Break and preferably close beyond the flag boundary with volume expansion (ChartSchool). |
| Entry trigger | Buy stop slightly above the upper boundary (bullish flag pattern) or sell stop slightly below the lower boundary (bearish flag pattern) (Forex.com). |
| Stop placement | Commonly just inside/just beyond the broken boundary, or beyond the opposite flag edge (Forex.com). |
| Target methods | Measured move: project the flagpole’s length from the breakout; conservative: minimum objective ≈ flag height (ChartSchool; Forex.com). |
| Typical depth | Practitioners often cap the pullback near the pole’s midpoint; “ideal” pullbacks frequently ~38–50% of the pole (Dukascopy). |
| Volume behavior | Heavy on the pole, lighter during the flag formation, and expanding again on breakout (ChartSchool). |
| Common failure | Weak/false flag breakouts without volume; “flags” misidentified without a true flagpole (ChartSchool; ThePatternSite). |
How to identify the bull flag and bear flag pattern
Bullish and bearish flag pattern recognition needs a steep flagpole, a short, parallel consolidation that usually tilts against the trend, and a breakout in the pole’s direction (ThePatternSite, Flags).
1) Clear prior thrust (flagpole). Look for an unusually steep, fast run; without a straight‑line or quick move, it is not a flag (Bulkowski).
2) Parallel consolidation (“flag”). Price oscillates between two roughly parallel lines; in bull flags those lines often slope down, in bear flags up (Investopedia).
3) Slope allowance. Many authorities prefer a tilt against the trend; some allow horizontal flags in bull markets as well (Investopedia’s bull flag note).
4) Duration is short. Bulkowski caps flags at less than three weeks; ChartSchool allows 1–12 weeks and notes debate above ~8 weeks. Patterns beyond 12 weeks are typically reclassified as rectangles (ChartSchool).
5) Depth limits. In a valid flag, the pullback generally should not exceed the pole’s midpoint; ideal pullbacks often ~38–50% of the pole (Investopedia; Dukascopy).
6) Volume sequence. Volume typically surges on the pole, recedes during the flag, and increases again on breakout; Bulkowski reports a declining volume trend in roughly three‑quarters of samples for both up and down breakouts (ChartSchool; Bulkowski).
7) Breakout direction. Continuation is assumed only on a decisive break with rising volume (ChartSchool).
Disagreements are mostly about duration cutoffs and whether flat flags qualify; both conventions appear in the cited literature.
Why the bull flag and bear flag pattern forms
Bull and bear flag formation is commonly interpreted as a brief pause as supply and demand rebalance before the prior trend resumes. Sources frame flags as short consolidations after sharp moves, followed by resumption when one side overwhelms the other (Investopedia’s continuation overview and ChartSchool). This psychological framing is an interpretation, not an empirically tested causal mechanism.
How traders trade the bull flag and bear flag pattern
Flag trading strategies center on breakout entries, structure‑based stops, and measured‑move targets.
-
Entry. Place a stop order just beyond the boundary: buy stop above the upper flag line (bull flag trading) or sell stop below the lower line (bear flag) (Forex.com).
-
Confirmation. Many wait for a closing break with volume to confirm the move and avoid false flag breakouts (ChartSchool).
-
Bulkowski’s caution for extreme variants. For high‑and‑tight flags, wait for a close above the highest peak rather than a mere trendline nick (ThePatternSite, High and Tight Flag).
-
Stop placement. For a bull flag, common stops are just below the breakout level (inside the flag) or below the recent swing low/flag support; for a bear flag, just above the breakout level or above the recent swing high/flag resistance. Tighter stops (near the broken boundary) limit loss on failed breaks; structural stops (beyond the opposite edge) risk more per trade but better reflect pattern invalidation (Forex.com; crypto‑focused guidance often places the stop below flag support in bull flags, per Cointelegraph).
-
Targets. Two conventions: (a) minimal target ≈ flag height added/subtracted from the breakout; (b) full measured move using the flagpole length projected from the breakout (ChartSchool; Forex.com).
Illustration (example math only, not advice):
– Suppose a bull flag on a daily chart. The flag pole runs from $50 to $60 (+$10).
– The flag consolidates between $58 (lower boundary) and $59.50 (upper boundary), a ~$1.50 height.
– Entry: buy stop at $59.60; assume a fill at $59.62.
– Stop: $57.90, just below the $58 flag low → risk $1.72.
– Target A (flag height): $59.62 + ~$1.50 = $61.12.
– Target B (measured move): $59.62 + $10.00 = $69.62.
– R/R to A ≈ 0.87:1; R/R to B ≈ 5.8:1.
Caveat: This is a simplified illustration; real fills, fees, slippage, volatility, and position sizing materially affect outcomes. Measured‑move targets are not guarantees; many patterns fail or stall before full projection.
What the evidence says about the bull flag and bear flag pattern
Evidence in practitioner sources is descriptive and rule‑based; peer‑reviewed, flag‑specific studies are not cited in the core references below. Thomas Bulkowski’s online flags summary documents identification guidelines, volume tendencies, and measure‑rule variants and notes that statistics were updated on August 27, 2020 (ThePatternSite, Flags). He reports, among other items, that volume trends downward during the flag in roughly 74–77% of cases and that flags break out upward 60% of the time. Bulkowski emphasizes that his numbers are based on “hundreds of perfect trades,” and that his flag performance measures short‑term swings, which he says yields small average moves; his pages do not disclose full samples online. His high‑and‑tight flag page (updated August 26, 2020) defines a ≥90% rise in ≤2 months and uses a half‑height target (ThePatternSite, High and Tight Flag). No peer‑reviewed, flag‑specific studies appear in these sources; readers should test written definitions on their own instruments and timeframes.
When the bull flag and bear flag pattern fails
Flag failures cluster around context and execution:
-
No real flagpole. After a choppy drift, a small channel forms but no decisive thrust preceded it. Classical references warn that without a sharp pole, continuation is questionable (ChartSchool; Bulkowski).
-
Loose or overlong flags. Jagged action pokes through lines or the “flag” stretches beyond the short‑term window. Bulkowski notes tight flags tend to outperform loose ones; long consolidations fit rectangles/channels in his taxonomy (ThePatternSite).
-
Deep retracement. A bull flag that undercuts the pole’s midpoint (or a bear flag that exceeds it) risks morphing into a broader range or reversal; many practitioners cap depth near 50% (Investopedia; Dukascopy).
-
Weak/low‑volume breakout. Intrabar pokes beyond the line without volume expansion often slip back inside the flag. ChartSchool expects volume resurgence on valid breaks; for high‑and‑tight flags, Bulkowski urges confirmation on a close above the prior peak (ChartSchool; ThePatternSite).
-
Opposite‑direction break. A bull flag that breaks down or a bear flag that breaks up invalidates the continuation thesis; trend bias must be reassessed (Investopedia).
Look‑alikes for the bull flag and bear flag pattern and how to tell them apart
| Pattern | How it differs | Where to read more |
|---|---|---|
| Pennant pattern | Converging trendlines (small triangle) after the pole rather than parallel lines; duration also short. | StockCharts’ pennant definition is paired with flags (ChartSchool: Flags and Pennants). |
| Rising/Falling Wedge | Converging, sloped boundaries; often longer and can be reversal‑prone. Flags use parallel lines. | See our wedge explainer: Rising Wedge and Falling Wedge (/rising-falling-wedge) |
| Rectangle/Channel | Duration distinction: Bulkowski caps flags at <3 weeks; ChartSchool reclassifies flags older than 12 weeks as rectangles. | Duration ranges discussed by ChartSchool; Bulkowski’s duration cap appears on ThePatternSite. |
| Cup and Handle | Rounded base plus a short handle; lacks a fast flagpole with a small parallel channel. | See our guide: Cup and Handle (/cup-and-handle-pattern) |
Tracking the bull flag and bear flag pattern in TakeProfit (vendor tools)
This vendor‑labeled section describes how to work with flags in the TakeProfit platform.
-
Draw the flag. Use Parallel Channel to outline upper/lower boundaries and a Line or Arrow to mark the flagpole. Label key levels with Horizontal Ray.
-
Measure it. Use Quick Measure or Date & Price to capture pole height (price and bars) and count flag duration. The Fixed Range Volume Profile can show activity inside the flag range (see TakeProfit documentation for Measurement tools).
-
Plan the trade. Model entry, stop, and both target types with the Long‑Short Tool; visualize risk/reward before placing real orders. The Long‑Short Tool is a planner only; it does not send orders.
Limitations: there is no automatic flag detector; you draw the pattern and monitor breakout levels by hand. Also, the Long‑Short Tool is a planner, not an order ticket (per product docs). In short: TakeProfit supports manual workflows for bull and bear flag patterns but does not auto‑recognize the chart pattern.
FAQ
- What’s the difference between a bull flag and a bear flag?
-
Same geometry—parallel channel after a sharp move—opposite context. A bull flag forms in an uptrend and typically slopes down; a bear flag forms in a downtrend and typically slopes up.
-
What does a bull flag indicate?
-
A brief pause after a strong up‑move, with potential continuation once price breaks and, preferably, closes above the flag on higher volume.
-
What happens if a bear flag fails?
-
If price breaks up through the flag and holds, the bearish continuation thesis fails; that move can start a counter‑trend rally and requires reassessing bias.
-
What’s the success rate of flag patterns?
- There is no widely accepted, peer‑reviewed win rate. Bulkowski’s online research (updated Aug 27, 2020) reports that flags break out upward 60% of the time and that volume typically trends downward during the flag; he also notes results are based on “hundreds of perfect trades” and short‑swing definitions that produce small average moves. Treat any “win rate” claim cautiously and test on your market and timeframe.
This page is educational; it is not investment advice. To practice drawing and measuring flags, see TakeProfit’s Measurement tools guide: TakeProfit docs: measurement tools