Last updated: September 2026
Disclosure: The section on tracking the pattern uses TakeProfit’s charting tools as a worked example; other charting platforms offer comparable drawing tools and price alerts.
Quick answer: Ascending and descending triangles are right‑angle consolidation patterns with one flat boundary and an opposing sloped boundary. These patterns complete on a breakout confirmed by a close beyond the line. A common target is the pattern’s height projected from the breakout. Thomas Bulkowski reports median breakouts occur about 61–65% of the way to the apex.
Best used (verdict for skimmers)
– Instruments: appears across liquid equities, futures, and forex; patterns are fractal across timeframes (Fidelity education).
– Timeframes: on daily charts, formations often last 1–3 months; shorter/longer do occur (StockCharts).
– Context: often mid‑trend continuations; trade the breakout in either direction, with confirmation and volume as preferred filters (StockCharts; Investopedia).
At a glance
| Attribute | Detail |
|---|---|
| Type | Ascending triangle is taught as a bullish continuation, but it can break either way (StockCharts ChartSchool). Descending triangle is framed as bearish continuation yet can break either way; Bulkowski found upward breaks 53% (see methodology; Descending Triangle). |
| Signal direction | Ascending triangle upward breakouts occurred 63% (see methodology). Descending triangle upward 53% and downward 47% (same source). |
| Where it forms (trend context) | Can follow any trend; classical treatment shows mid‑trend continuations (StockCharts ChartSchool). |
| Typical duration/timeframe | Often 1–3 months on daily charts; shorter or longer examples occur (StockCharts ChartSchool). |
| Confirmation | Many authors require a close beyond the boundary to confirm the breakout (StockCharts ChartSchool). |
| Entry trigger | Common tactics: buy stop slightly above the flat top (ascending) or sell stop below the flat bottom (descending). Some traders wait for a close (Investopedia). |
| Stop placement | Stops are often placed on the opposite side of the pattern or beyond the latest swing; broker education illustrates this (Fidelity Learning Center; link below). |
| Target method | Measured move: add/subtract the widest height from the breakout price (StockCharts; Investopedia). Bulkowski scales height by “% meeting price target” before projecting (see methodology). |
| Common post‑break behavior | Throwbacks/pullbacks occur frequently: about 60–64% across variants (see methodology; Bulkowski). |
| Breakout timing | Median breakout occurs about 61–65% of the distance to the apex (see methodology; Bulkowski). |
Methodology and source notes (Bulkowski)
– Source pages: Ascending Triangle and Descending Triangle on ThePatternSite (US stocks; >1,400 and >1,300 “perfect trades,” respectively) (Ascending Triangle; Descending Triangle).
– Vintage/period: the web pages aggregate results across multiple decades; exact date ranges are not published on the pages. Bulkowski notes performance has dropped substantially since the 1990s on descending triangles (same source).
– Headline metrics used in this guide (all from the pages above): upward breakout frequency (ascending 63%; descending 53% up/47% down), average move after break (ascending up 43%/down 13%; descending up 38%/down 15%), break‑even failure rate (ascending up 17%/down 38%; descending ~22–23% both ways), throwback/pullback rates (about 58–64%), target‑hit rates (ascending up 70%/down 44%; descending up 64%/down 50%), and median breakout timing (61–65% to apex).
How to identify ascending and descending triangles — a sourced checklist
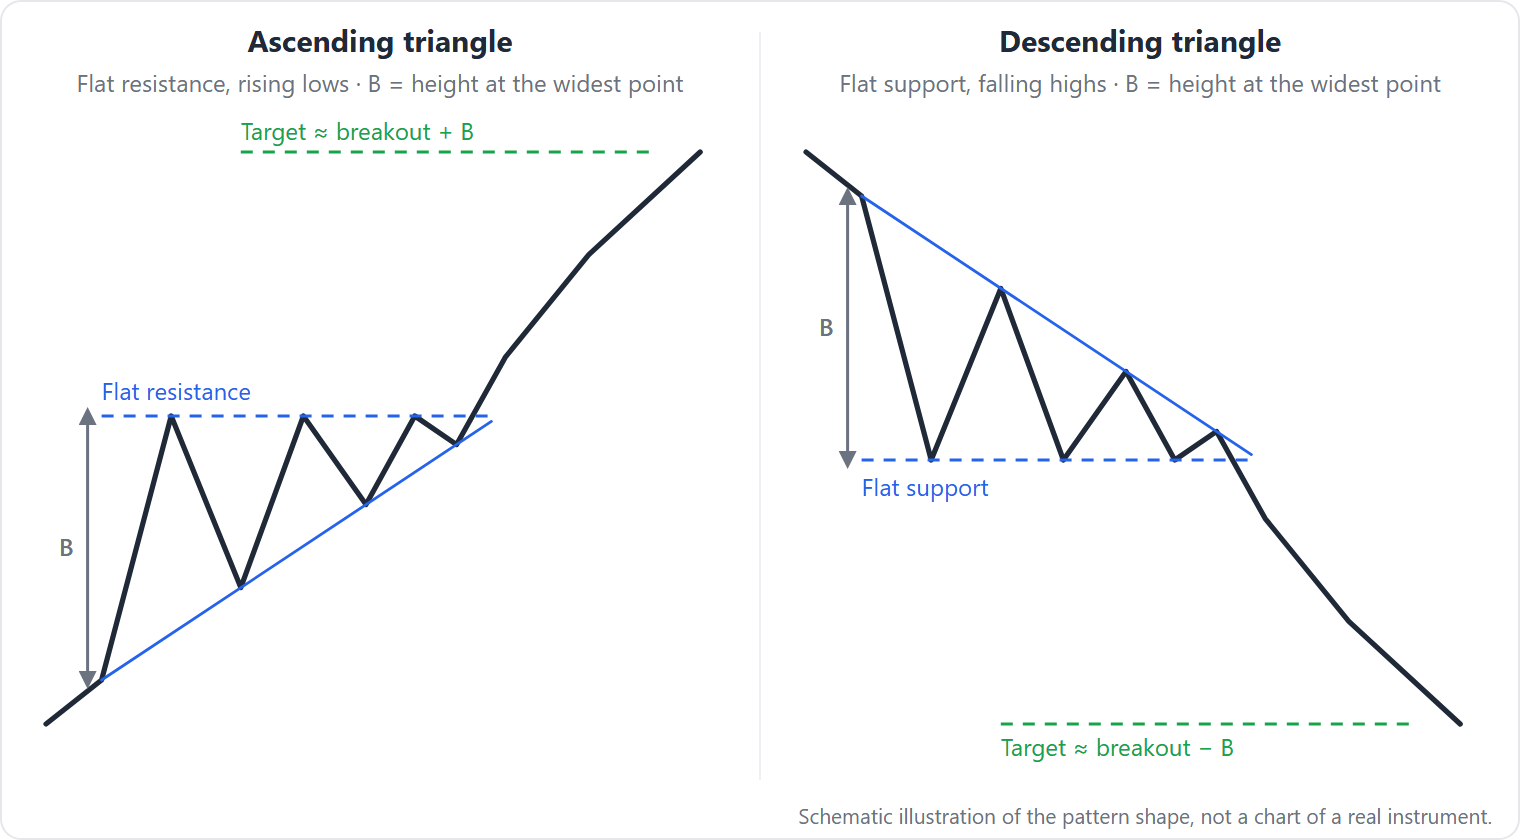
Ascending and descending triangles use two converging trendlines, one horizontal and one sloping, and complete when price closes beyond a boundary (StockCharts ChartSchool).
- Geometry and touches:
- A right‑angle triangle formed by a flat boundary and an opposite sloping boundary (StockCharts ChartSchool).
- Bulkowski’s guideline: price must touch one trendline at least three times and the other at least twice. Price should cross side to side and “fill” the pattern, not leave white space (Ascending Triangle; Descending Triangle).
-
A practitioner convention is at least five total touches (3+2 or 2+3) before a breakout is trusted (BabyPips).
-
Variant‑specific layout:
- Ascending triangle: flat top (resistance) and rising lows (StockCharts ChartSchool).
-
Descending triangle: flat bottom (support) and falling highs (StockCharts ChartSchool).
-
Confirmation and timing:
- Completion is commonly defined by a close outside a trendline; intrabar spikes without a close are treated cautiously (StockCharts ChartSchool).
-
Median breakout occurs about 61–65% of the distance to the apex (Bulkowski; see methodology).
-
Volume behavior:
- Volume often contracts during formation and can expand on breakout (StockCharts ChartSchool).
-
Bulkowski reports receding volume during formation in about 78% of cases and notes that rising volume during formation is linked to stronger median outcomes (see methodology).
-
Context and disagreements:
- Classical sources frame triangles as continuations, but Bulkowski scores them regardless of prior trend and shows breakouts can go either way (StockCharts; Bulkowski).
Real‑market examples (external, checkable)
- Ascending triangle (StockCharts example): PRTL formed an ascending triangle over roughly six months. Price broke above resistance near 24, advanced to about 30.75, and reached the measured target near 34 within two months; later highs extended further (StockCharts Ascending Triangle page).
- Descending triangle: Bulkowski’s descending‑triangle page and “busted” descending‑triangle page include annotated examples and performance breakdowns; upward breakouts occurred 53% overall, and busted downward breaks that reverse and close above the top trendline showed strong average rises (Descending Triangle; Busted Descending Triangles).
Why ascending and descending triangles form — interpretation, not proof
Ascending and descending triangles are read as consolidations where supply and demand compress into a narrower range before resolution. ChartSchool presents ascending triangles as accumulation beneath resistance and descending triangles as distribution above support (StockCharts ChartSchool).
These explanations are heuristics. Academic work found mathematically defined patterns (including triangles) can carry informational content, with results sensitive to definitions and costs (New York Times; Lorenzoni et al., 2007).
How traders trade ascending and descending triangles — entries, stops, targets, example
Ascending and descending triangles are commonly traded on breakouts. Entries sit just beyond the boundary or follow a confirmed close. Stops go beyond the opposite side or a nearby swing. Targets use the measured height (Investopedia; Fidelity Learning Center).
- Entries
- Ascending: buy an upside breakout above the flat top. Conservative traders wait for a close; aggressive traders use a buy stop a tick above resistance (Bulkowski; Investopedia).
-
Descending: short a breakdown below flat support. Also consider an upside break, as Bulkowski found upward resolution slightly more frequent (53%; see methodology).
-
Confirmation filters before entry
- Prefer at least one close beyond the trendline and a volume expansion on the break (StockCharts; Investopedia).
-
To reduce head fakes, some wait for two closes beyond the boundary (Investopedia).
-
Stops
-
Place stops on the opposite side of the pattern or beyond the latest swing. Fidelity illustrates stops beyond support/resistance; Bulkowski anchors stops to the opposite boundary unless unreasonably distant (same sources).
-
Targets
- Classic measured move: add (up) or subtract (down) the widest height of the triangle from the breakout price (StockCharts; Investopedia).
- Bulkowski adjustment: multiply the height by the “percentage meeting price target” before projecting (ascending up‑breaks: 70%; see methodology). This is our editorial calculation following his rule and his target‑hit rate.
Illustration (numbers only, no chart):
– Suppose an ascending triangle has resistance at 50.00 and the lowest valley at 44.00. Height = 6.00.
– Entry: buy stop at 50.10 after confirmation. Stop: 48.80 below the latest swing low.
– Classic target: 50.10 + 6.00 = 56.10.
– Bulkowski‑style adjusted target: 6.00 × 0.70 = 4.20; 50.10 + 4.20 = 54.30 (rule and percentage from Bulkowski; see methodology).
– Risk per share: 1.30. Reward to adjusted/classic targets: 4.20 and 6.00.
What the evidence says about ascending and descending triangles — statistics and critiques
Ascending and descending triangles have been quantified by Bulkowski on US stocks and examined in academic work using algorithmic definitions.
- Ascending triangle (Bulkowski; see methodology; Ascending Triangle)
- Upward breakout frequency 63%; break‑even failure (gain <5%) after upward breaks 17%; average rise 43%; throwback rate 64%; percentage meeting price target 70%.
- Downward breaks: break‑even failure 38%, average decline 13%, target met 44%.
-
Patterns preceded by an intermediate‑term rise (3–6 months) averaged +49% after upward breakouts.
-
Descending triangle (Bulkowski; see methodology; Descending Triangle)
-
Upward breakout 53%; break‑even failure ~22–23% both directions; average rise 38% (up) and decline 15% (down); throwback/pullback ≈60%/58%; target met 64% (up) and 50% (down). Bulkowski notes performance dropped since the 1990s.
-
Busted patterns
-
A “busted descending triangle” breaks down, drops no more than 10%, reverses, and closes above the top trendline; Bulkowski reports average rises around 40% when traded in the new direction (Busted Descending Triangles).
-
Academic perspective
- Lo, Mamaysky, and Wang defined patterns and tested ~750 stocks over 35 years ending in 1996; the New York Times summary reports mixed efficacy and sensitivity to definitions (New York Times).
- Lorenzoni et al. (2007) find statistically significant informational content for triangles/rectangles/head‑and‑shoulders under their framework (Lorenzoni et al.).
Caveats: results vary by regime, location in the prior trend, volume slope, and execution. Bulkowski’s “perfect trades” assume ideal breakouts; transaction costs and throwbacks can affect realized outcomes (see methodology).
When ascending and descending triangles fail — modes, conditions, chart tells
- Late/apex breakouts
- Condition: breakout occurs near the apex; Bulkowski’s median is 61–65% to apex.
-
Chart tell: small‑range breakout candles without volume expansion; quick stall.
-
Throwbacks/pullbacks
- Condition: price returns to the boundary after breakout; recorded around 58–64% across variants.
-
Chart tell: confirmed close beyond the line, then a revisit that trades back to or inside the boundary.
-
Downward breaks of ascending triangles
- Condition: descending resolution from an ascending triangle tends to underperform.
-
Chart tell: loss of rising‑lows trendline followed by choppy, shallow decline; Bulkowski shows 38% break‑even failures and 13% average decline.
-
Busted triangles
- Condition: initial break travels ≤10%, reverses, and closes beyond the opposite side; Bulkowski terms these “busts.”
-
Chart tell: clear close back through the far boundary after a shallow initial move.
-
Multi‑peak variations
- Condition: broad, choppy versions with many small peaks can underperform.
- Chart tell: saw‑tooth highs along the flat side and messy interior “white space” (Bulkowski).
Look‑alikes for ascending and descending triangles and how to tell them apart
| Pattern | How it differs | Where to read more |
|---|---|---|
| Symmetrical triangle | Both sides slope toward the apex; no flat boundary. Break direction is less biased. Treated separately in a future page. | future page |
| Rising/falling wedge | Both boundaries slope in the same direction and converge; wedges often show reversal bias. Triangles need one flat side plus an opposite slope. | Rising Wedge and Falling Wedge |
| Double top/bottom | Two tests of a flat level without a converging opposite trendline; triangles need multiple touches and a sloping side. | Double Top and Double Bottom (M and W patterns) |
In practice, confirm a flat side plus a clearly sloped opposite boundary and enough touches (for example, ≥3 on one side, ≥2 on the other) to favor a triangle (Bulkowski).
Tracking ascending and descending triangles in TakeProfit — example workflow
TakeProfit is one way to draw and measure triangles manually. This is an example workflow; similar steps exist in other charting platforms.
- Draw the pattern
-
Use the Triangle Pattern tool to outline an ascending (flat top, rising lows) or descending (flat bottom, falling highs) triangle (TakeProfit Pattern tools).
-
Measure height and timing
-
Use measurement tools (Price Only; Date & Price) to capture vertical height and distance to the apex. Quick Measure helps with spot checks (TakeProfit docs).
-
Plan entries, stops, targets
- Use the Long‑Short Tool to model a breakout entry, a stop beyond the opposite boundary or latest swing, and a measured‑move target. The tool displays risk/reward and supports multiple targets (TakeProfit docs).
Limitations and compliance:
– The docs do not describe automatic triangle detection; drawing is manual. Alerts tied to pattern recognition are not described in the docs linked above (TakeProfit Pattern tools).
– The Long‑Short Tool is a planner, not an order ticket. For live orders you must use your broker’s platform and comply with your local trading rules and account agreements.
FAQ: ascending and descending triangles
- Is a descending triangle bearish?
-
Often taught as bearish, but Bulkowski found upward breakouts 53% in his US‑stock sample. Trade the confirmed direction, ideally after a close beyond the boundary and with supportive volume (Descending Triangle; Investopedia).
-
Is an ascending triangle bullish?
-
The ascending triangle has a bullish bias. Bulkowski reports upward breakouts 63% and a 43% average rise after upward breaks (see methodology).
-
How do you trade an ascending triangle?
-
Map a flat top and rising lows. Buy the upside breakout after a close or use a stop just above resistance. Place a stop under the latest swing or below the rising line. Project a target using measured height added to the breakout (Investopedia).
-
Is a descending triangle ever bullish?
-
Yes. Upward breakouts occurred 53% in Bulkowski’s sample, and “busted” breakdowns that reverse can rally after a close above the top trendline (Busted Descending Triangles).
-
Which triangle pattern is most successful?
- It varies by era and context. Bulkowski ranks ascending triangles better on upward breaks; several patterns’ performance has waned since the 1990s (see methodology).
This is not investment advice.
Learn more in TakeProfit’s guide to alerts: Alert trigger criteria