Last updated: October 2026
Disclosure: The section on tracking the pattern uses TakeProfit‘s charting tools as a worked example; other charting platforms offer comparable drawing tools and price alerts.
Quick answer: An ascending channel is a price corridor bounded by two upward-sloping, roughly parallel trendlines. A descending channel is its mirror image, sloping downward. Both form when price oscillates between rising or falling support and resistance, and the breakout can go either direction. Confirmation requires at least two touches on each boundary and a close outside the channel.
At a Glance — Key Facts
| Attribute | Ascending Channel | Descending Channel |
|---|---|---|
| Type | Continuation (if trend continues) or reversal (if breakout goes opposite). No consensus on fixed outcome. | Same – continuation or reversal depending on breakout direction. |
| Signal direction | Bullish structure (higher highs, higher lows), but breakout can be bullish or bearish. | Bearish structure (lower highs, lower lows), but breakout can be bearish or bullish. |
| Where it forms | In any prior trend (Bulkowski, thepatternsite.com, March 2023). | In any prior trend (Bulkowski). |
| Typical timeframe | No universal minimum duration. Appears on any timeframe. | Same. |
| Confirmation | Minimum two touches per trendline, near-parallel lines, price crosses full width, close outside boundary (Bulkowski). | Same. |
| Entry trigger (range) | Buy near lower trendline / sell near upper trendline. | Short near upper / cover near lower. |
| Entry trigger (breakout) | After close outside the boundary. | After close outside the boundary. |
| Stop placement | Range: beyond opposite boundary. Breakout: past entry side. | Range: beyond opposite boundary. Breakout: past entry side. |
| Target method | Often projected channel height from breakout point. | Same. |
| Most common failure | False breakout – close outside then reversal back inside. | Same. |
No primary source provides a numeric success rate, sample size, or performance statistics for channels. Bulkowski states: “I haven’t studied channels for performance (statistics)” (Bulkowski, thepatternsite.com).
What Is an Ascending or Descending Channel?
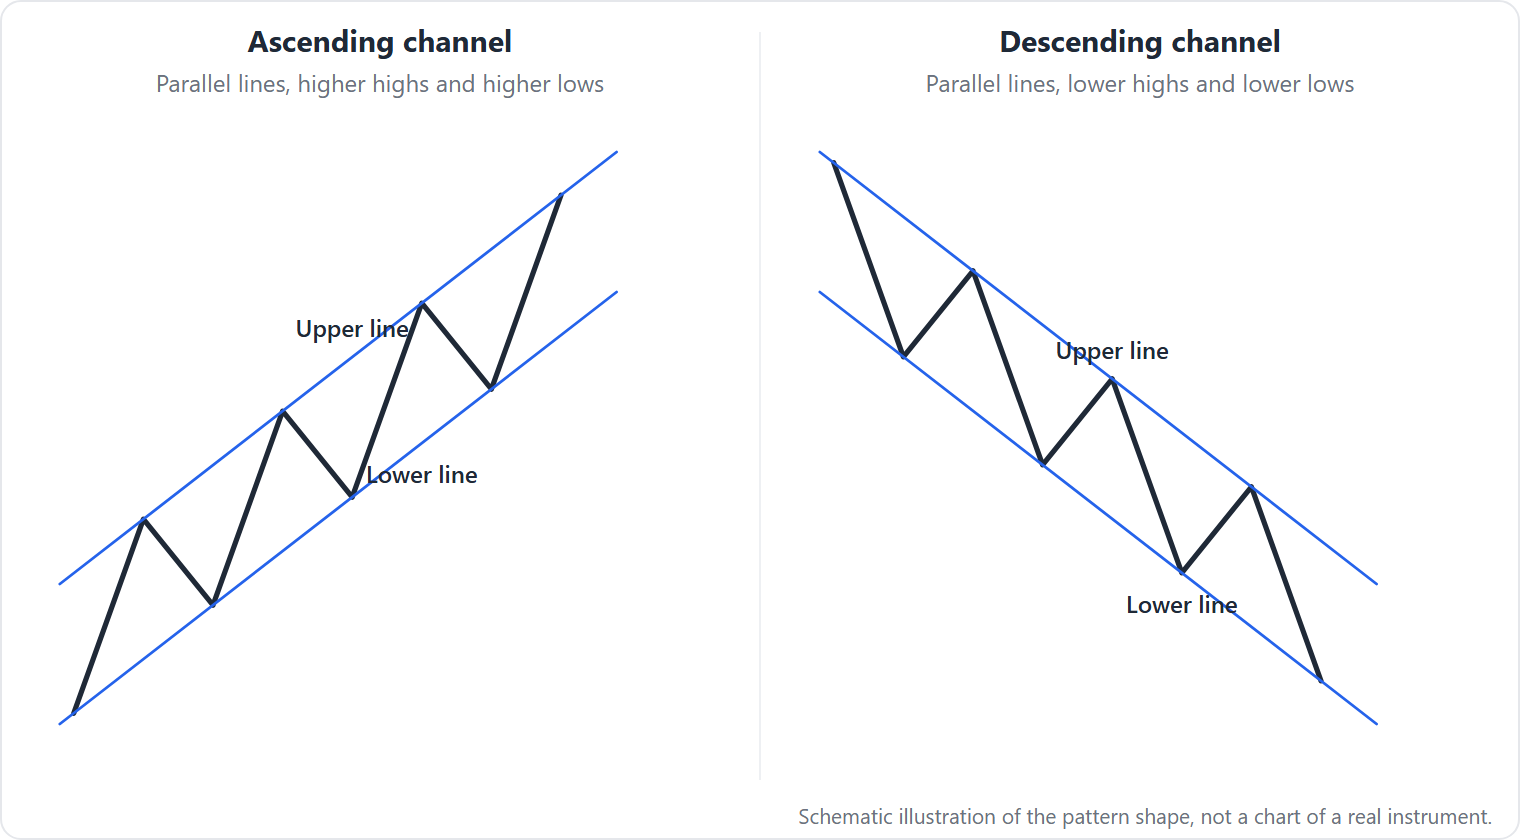
An ascending or descending channel is a chart pattern defined by two parallel or nearly parallel trendlines that slope upward (ascending) or downward (descending). The pattern is described by Thomas Bulkowski as “a pipe tilted up or down, but not horizontal” (Bulkowski, thepatternsite.com, March 2023). The channel captures a period during which price oscillates between rising support and rising resistance (ascending) or falling resistance and falling support (descending). The breakout direction is not predetermined: price can close outside either boundary, triggering a move in the direction of the breakout.
How to Identify an Ascending or Descending Channel
Use the following numbered checklist based on Bulkowski’s measurable criteria (Bulkowski, thepatternsite.com). Every criterion must be met for the pattern to qualify.
1. Two parallel sloping trendlines
Both trendlines must tilt in the same direction – up for an ascending channel, down for a descending channel. The lines should be parallel or nearly parallel. If the lines converge (point toward each other), the pattern is a wedge, not a channel.
2. Minimum two touches per trendline
You need at least two distinct touches (peaks or valleys) on each boundary. Count each touch where price reverses from the line. A touch that merely brushes the line and continues may not count as a true test.
3. Price crosses the full width
Price should travel from one trendline to the opposite trendline, nearly filling the space between them. If price only bounces near the middle, the channel is not fully formed.
4. Breakout defined by a close outside
A breakout occurs when price closes outside the trendline boundary. The breakout can be in any direction – above the upper trendline or below the lower trendline (Bulkowski).
5. Prior trend can be any direction
Unlike many secondary sources that require a prior uptrend, Bulkowski says the price trend leading into the channel can be from any direction. This means a channel can form after an uptrend, a downtrend, or even a sideways move.
6. Volume not required in primary definitions
Bulkowski does not require any volume condition. Some secondary sources (Chart Guys, August 2025) suggest volume tends to decline inside the channel and increase on breakout, but this is not part of the authoritative definition.
7. Slope angle not specified
No authoritative source provides a minimum or maximum slope angle. The slope must be clearly upward or downward (not horizontal), but there is no formal threshold.
Why Channels Form
The channel structure reflects a temporary tug-of-war between buyers and sellers. In an ascending channel, buyers step in at progressively higher support levels, while sellers cap gains at a rising resistance line. This creates a rising corridor where price oscillates within a controlled trend. The breakout occurs when one side overwhelms the other. If buyers push price through the upper trendline, the trend accelerates. If sellers break through the lower trendline, the uptrend is invalidated. This interpretation is a crowd-behavior explanation, not a proven mechanism (Bulkowski; Investopedia, May 2018).
How Traders Trade Channels
Range Trading Within the Channel
The simplest approach is to buy near the lower trendline and sell near the upper trendline, with stops placed beyond the opposite boundary. For an ascending channel, enter a long position when price touches the lower trendline and reverses upward. Place your stop loss just below the lower trendline. Target the upper trendline. For a descending channel, short near the upper trendline with a stop above it, targeting the lower trendline.
Breakout Trading
Wait for a close outside the channel boundary. Enter in the breakout direction when price confirms by continuing beyond the boundary. Place the stop loss on the opposite side of the channel. The target is often set by projecting the channel’s height (distance between the two trendlines) from the breakout point.
Worked Example (Ascending Channel, Hypothetical)
Illustration: Stock ABC forms an ascending channel. The lower trendline is at $50.00 and the upper trendline is at $60.00. The channel height is $10.00 ($60.00 − $50.00).
Range trade: Price touches the lower trendline at $51.00 and bounces. You buy at $51.00. Place a stop loss at $49.00 (just below the lower trendline). Set a target at $59.00 (near the upper trendline). Risk is $2.00 ($51.00 − $49.00). Reward is $8.00 ($59.00 − $51.00). Risk/reward ratio = 1:4.
Breakout trade: Price closes above the upper trendline at $60.50. You enter a long position at $60.50. Place a stop loss at $59.00 (just inside the channel). The measured-move target is the channel height ($10.00) added to the breakout point: $60.50 + $10.00 = $70.50. Risk is $1.50 ($60.50 − $59.00). Reward is $10.00 ($70.50 − $60.50). Risk/reward ratio = 1:6.67.
Note: These are hypothetical prices for illustration only. Do not trade based on this example.
Bulkowski advises: for up-sloping channels, trade from the long side – buy when price rebounds at the bottom trendline and avoid going short inside the channel. For down-sloping channels, short when price turns down at the top trendline and avoid going long inside the channel (Bulkowski).
What the Evidence Says
No credible study with sample and period exists for channels as defined here. Bulkowski states on his channel page: “I haven’t studied channels for performance (statistics)” (Bulkowski). Secondary sources (Chart Guys, August 2025) report approximate numbers – ~57% downward break for ascending channels, ~43% upward break – but the underlying sample, market universe, and time period are not provided. The academic literature has not separately tested channels from other chart patterns. What a trader can do is test their own trade journal for breakout direction frequency, track throwback rates, and compare volume behavior. Without a published dataset, any claimed edge for channels remains untested.
When Channels Fail
1. False Breakout (Close Then Reverse)
Price closes outside the boundary but reverses back inside the channel within one or two bars. The breakout fails. This often occurs with low volume on the breakout candle. The trader sees a close above resistance, enters long, then price immediately falls back below the boundary.
2. Throwback / Pullback
Price breaks out, moves briefly in the breakout direction, then returns to retest the channel boundary. Chart Guys (August 2025) reports a throwback/pullback frequency of ~55% for channels, based on secondary source. This can shake early entries if the stop is too tight. The trader sees a breakout, enters, then price returns almost to the entry level before resuming. A pullback that holds above the boundary is normal; one that closes inside the channel may invalidate the trade.
3. Trend Exhaustion
After several touches on both boundaries, momentum fades. The channel widens or price grinds to a halt. Often, the RSI (Investopedia, May 2018) shows divergence – for example, price makes another higher low in an ascending channel, but RSI makes a lower low. The trader sees decreasing range, longer wicks, and loss of directional energy. The eventual breakout, when it comes, is weak or reverses quickly.
Look-Alikes: How to Tell Channels Apart from Similar Patterns
| Pattern | How It Differs | Where to Read More |
|---|---|---|
| Rising wedge | Trendlines converge (both slope up but the lower line is steeper). Breakout is typically downward. | Rising and falling wedge |
| Ascending triangle | Resistance is flat (horizontal), support rises. Breakout is typically upward. | Ascending and descending triangle |
| Bull flag / bear flag | Short consolidation after a steep move. Flag is horizontal or mild slope, and the prior move is vertical. | Bull flag and bear flag |
| Rectangle (horizontal channel) | Both trendlines are horizontal – no slope. | Future page (rectangle pattern) |
The key distinguishing feature of a channel is the parallel or near-parallel trendlines. If the lines are converging, it is not a channel. If the lines are horizontal, it is a rectangle. If one line is flat and the other is sloping, it is a triangle.
Tracking Channels on a Chart in TakeProfit
Drawing the Channel
Use the Parallel Channel tool (Alt+Shift+C). Click two points to set the initial width and angle. Then adjust the control points to align the lines with the swing highs and swing lows. The tool can be extended infinitely to the right. You can also enable a middle line (optional) to see the channel’s median.
Marking Breakout Level
Place a Horizontal Ray (Alt+Shift+H) at the boundary you expect to break. This gives you a visual reference line.
Limitation: TakeProfit does not automatically detect channel patterns. All drawing, level placement, and alert configuration are manual. The platform does not scan for channels across symbols or timeframes. Backtesting must be done manually or via your own trade journal.
FAQ
Is ascending channel bullish or bearish?
Structurally it shows rising highs and lows, but the breakout can go either way. Bulkowski reports no fixed direction.
What is the difference between ascending channel and rising wedge?
The wedge has converging trendlines; the channel’s lines are parallel or nearly parallel.
How do you trade an ascending channel?
Range: buy support, sell resistance. Breakout: after a close outside, trade in breakout direction with a measured-move target.
What is the most successful trading pattern?
No pattern is universally “most successful.” Channels have around 57% downward break (secondary source, no sample given, Chart Guys, August 2025).
Is an ascending triangle pattern bullish?
It is generally bullish (flat resistance, rising support). A channel has both lines rising.
What is the 3-5-7 rule in trading?
Not related to channels; it is a generic risk management rule about position size or trade frequency.
This page is for educational purposes only and does not constitute investment advice. Trading involves financial risk.