Last updated: October 2026
Disclosure: The section on tracking the pattern uses TakeProfit‘s charting tools as a worked example; other charting platforms offer comparable drawing tools and price alerts.
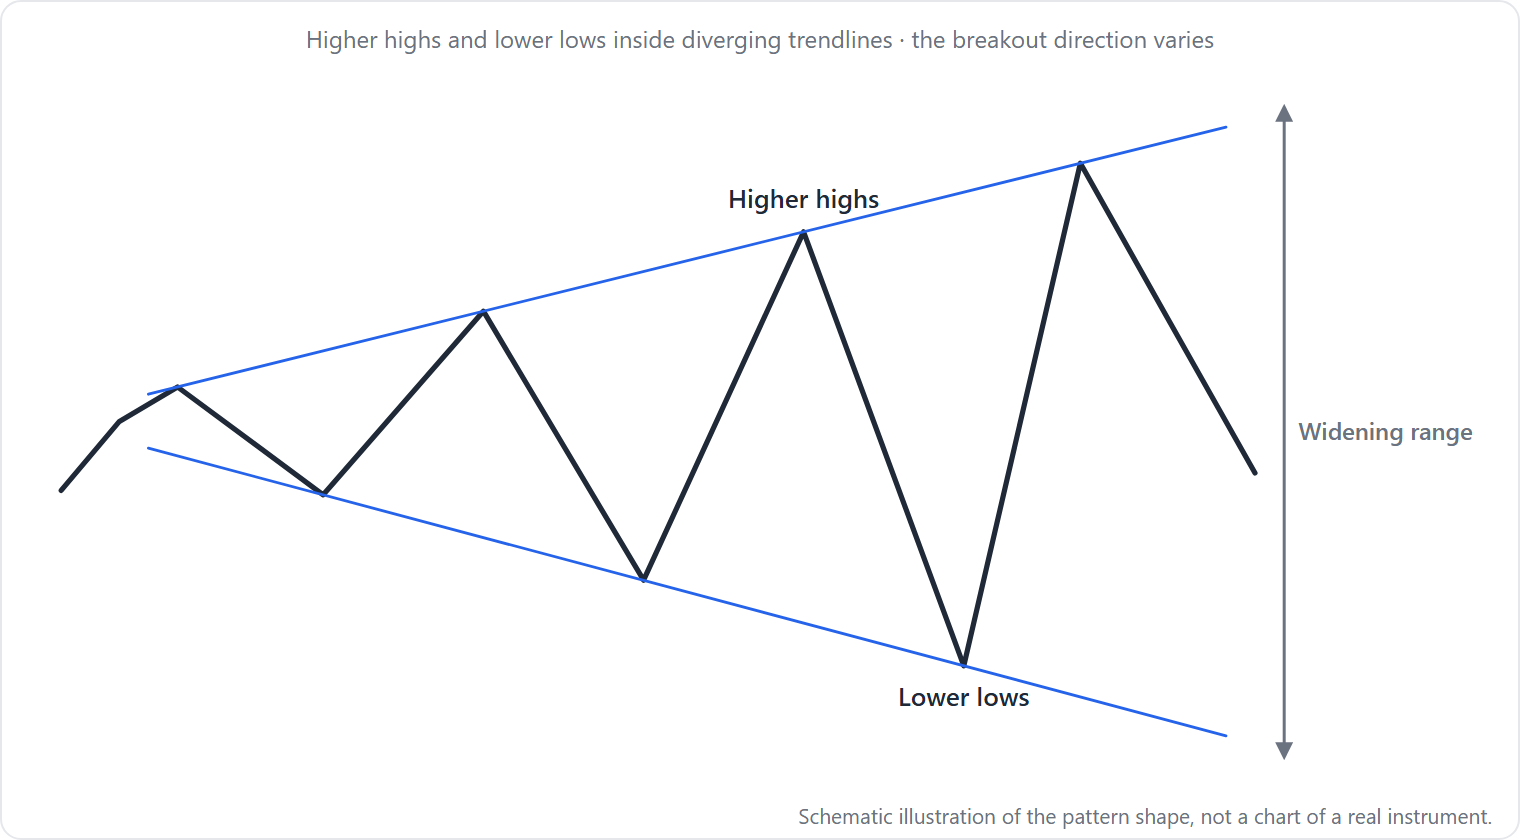
Quick answer: The megaphone pattern, also called a broadening formation, shows price making higher highs and lower lows with two diverging trendlines. It signals rising volatility and indecision. Confirmation comes when price closes decisively above the upper trendline (bullish) or below the lower trendline (bearish), ideally on increasing volume.
At a Glance — Key Facts Table
| Attribute | Value |
|---|---|
| Type | Reversal or continuation (depends on breakout direction) |
| Signal direction | Bullish (upward breakout) or Bearish (downward breakout) |
| Where it forms | After an uptrend (broadening top) or downtrend (broadening bottom) |
| Typical timeframe | Intermediate-term (3–6 months leading trend preferred) |
| Confirmation | Price closes above upper or below lower trendline; ideally with rising volume |
| Entry trigger | Breakout candle close, or buy at 3rd touch (high risk) |
| Stop placement | A penny below lowest valley (long) or above highest peak (short) |
| Target method | Measure rule: pattern height added to top (up breakout) or subtracted from bottom (down breakout) |
| Most common failure | False breakout followed by direction reversal; throwback/pullback after breakout |
How to Identify the Megaphone Pattern
The megaphone pattern is identified by a set of measurable criteria that distinguish it from other chart structures. Thomas Bulkowski’s work (Thomas Bulkowski, thepatternsite.com, July 2025) provides the most detailed framework.
Checklist of Measurable Criteria
-
Prior trend: Price trend leading to the pattern must be upward for a broadening top, downward for a broadening bottom. This context determines whether the pattern acts as a reversal or continuation signal.
-
Shape: Price makes higher peaks AND lower valleys — a widening “megaphone” shape. Each swing high exceeds the previous one, while each swing low drops below the prior low.
-
Trendlines: The top trendline slopes upward; the bottom trendline slopes downward. Both lines diverge to the right, creating an expanding range.
-
Touches: At least five touches total. Three peaks or three valleys should touch the associated trendline, with two or more touches of the other trendline. The second of the three touches should ideally touch the line (not just approach it). This avoids misidentifying a channel with a runaway spike.
-
White space: Price should cross from side to side, filling the pattern area with movement. A pattern where price hugs one side is not a valid megaphone.
-
Breakout: Price pierces a trendline or moves above/below the pattern’s end. Upward breakouts occur 60% of the time (Bulkowski, July 2025). The breakout direction is not predetermined until it happens.
The StockCharts ChartSchool defines the broadening top similarly as “successive higher peaks and lower valleys” with diverging trendlines, though without Bulkowski’s five-touch rule.
Why the Megaphone Pattern Forms
The megaphone pattern reflects rising volatility and increasing disagreement between buyers and sellers. As price swings widen, each side becomes more aggressive — buyers push prices higher on rallies, but sellers drive them lower on declines. This behavior often occurs at turning points where the prior trend’s momentum is fading and uncertainty is high. The pattern visually captures a market in which neither bulls nor bears can establish lasting control, leading to progressively larger excursions in both directions (StockCharts ChartSchool; Bulkowski, July 2025).
How Traders Trade the Megaphone Pattern
Entry, Stop, and Target Conventions
Traders approach the megaphone pattern in two primary ways: intraformation trades and breakout trades. Each has different risk profiles.
Intraformation trade: You buy when price rebounds off the lower trendline or short when price touches the upper trendline and begins falling. Bulkowski (July 2025) notes that buying at the third touch of the bottom trendline is a high-risk entry but can capture a move before the breakout.
Breakout trade: You enter on a close above the upper trendline (long) or below the lower trendline (short). This is the standard confirmation method.
Stop placement: For long trades, place a stop a penny below the lowest valley in the pattern. For short trades, place a stop a penny above the highest peak.
Measure rule (upward breakout): Compute the difference between the highest peak and lowest valley (height). Add the height to the pattern’s top. This works 66% of the time (Thomas Bulkowski, thepatternsite.com, July 2025). Alternatively, multiply the height by 66% and add it to the highest peak.
Measure rule (downward breakout): Subtract the height from the pattern’s bottom. Works 42% of the time (Bulkowski, July 2025). Or multiply the height by 42% and subtract it from the lowest valley.
Worked Example (Illustration)
Hypothetical stock ABC:
– Pattern highest peak: $110
– Pattern lowest valley: $90
– Height = $110 − $90 = $20
– Upward breakout: price closes above the upper trendline at $112
– Target (measure rule): $110 + $20 = $130
– Stop (long): $90 − $0.01 = $89.99
– Risk per share: $112 − $89.99 = $22.01
– Reward per share: $130 − $112 = $18.00
– Risk/reward ratio: 1:0.82
This example shows that the measure rule target gives an unfavorable risk/reward on its own; traders often combine it with other factors such as overhead resistance or partial declines.
What the Evidence Says
Published Statistics
The megaphone pattern’s published evidence comes from Bulkowski’s studies (Thomas Bulkowski, thepatternsite.com, July 2025), which provide the most comprehensive data available.
Broadening tops (bull market):
– Upward breakouts: 1,215 perfect trades. Average rise 42%. Break-even failure rate 18%. Throwback rate 67%. Performance rank 22nd out of 39 patterns.
– Downward breakouts: 804 perfect trades. Average decline 13%. Failure rate 27%. Pullback rate 67%. Performance rank 28th out of 36.
Broadening bottoms (bull market):
– Upward breakouts: 599 perfect trades. Average rise 45%. Failure rate 16%. Throwback rate 69%. Rank 15th out of 39.
– Downward breakouts: 405 perfect trades. Average decline 15%. Failure rate 26%. Pullback rate 62%. Rank 23rd out of 36.
Performance by decade (broadening tops, bull market):
– Upward breakouts: 1990s = 40% average rise; 2000s = 49%; 2010s = 36%.
– Downward breakouts: 1990s = 16% average decline; 2000s = 12%; 2010s = 13%.
Published Criticism
Bulkowski (July 2025) explicitly states that the broadening top “is a poor performer” with above-average failure rates and below-average average rise or decline. The broadening bottom ranks mid-list or worse overall, though it has “one redeeming value: the partial decline does a good job of predicting an upward breakout.” Traders should approach these patterns with cautious expectations.
When the Megaphone Pattern Fails
The megaphone pattern fails in several specific ways, each tied to identifiable market conditions.
-
False breakout after a long-term uptrend: If the preceding uptrend has lasted a year or more, the pattern may signal the end of the trend rather than a continuation. Avoid buying when the uptrend is extended (Bulkowski, July 2025). The chart shows a breakout candle that quickly reverses into the pattern.
-
Throwback or pullback derails performance: The price returns to the trendline after the breakout (67% of the time for both directions). This can trigger stops or turn into a full reversal. You see price retesting the trendline within a few days.
-
Tall or steep patterns produce exaggerated targets: Unusually tall patterns have heights that generate targets far beyond what the market can reach. Bulkowski warns to “avoid unusually tall chart patterns.” The measured target may lie in previously uncharted territory.
-
Multi-peak patterns near the top trendline: Multiple touches of the upper trendline increase the risk of failure. This suggests distribution rather than continuation.
Look-Alikes — How to Tell Them Apart
| Feature | Megaphone Pattern | Symmetrical Triangle | Rising/Falling Wedge |
|---|---|---|---|
| Trendlines | Diverge (higher highs, lower lows) | Converge (lower highs, higher lows) | Both slope same direction (up or down) |
| Volatility | Expanding | Contracting | Expanding or contracting |
| Breakout direction | Up 60%, down 40% (Bulkowski) | Roughly equal | Down 52% for ascending wedge; up 72% for descending wedge (Bulkowski) |
| Touch requirement | Minimum 5 touches | At least 4 touches | Minimum 5 touches (3 peaks + 3 valleys) |
For a full comparison, see the rising/falling wedge guide. The diamond pattern, a future topic, combines a broadening and a converging phase — it is a separate structure not covered here.
Tracking the Megaphone Pattern in TakeProfit
TakeProfit provides the drawing tools needed to mark and monitor a megaphone pattern manually, since the platform does not offer automatic pattern detection for broadening formations. Here is how to set up the trade using its chart tools.
Practical Steps
-
Draw the top trendline using the Ray tool (extends infinitely to the right). Connect at least three swing highs that form the pattern’s upper boundary. The Ray tool ensures the line projects forward for breakout tracking.
-
Draw the bottom trendline as a Ray connecting at least three swing lows. The pattern requires both lines to diverge.
-
Mark the pattern height using Quick Measure (Shift + M) — measure from the highest peak to the lowest valley. This gives you the height for the measure rule.
-
Set a Price Alert on the breakout level: above the top trendline for longs, below the bottom trendline for shorts. The alert triggers when price crosses the level, allowing you to act without constant monitoring.
-
Use the Long-Short Tool (Alt + L) to visualize the entry, stop, and target based on the measure rule. The tool shows risk/reward ratios in real time. You can enter the entry price, stop level, and two take-profit targets; the tool calculates the ratio automatically.
-
For additional reference, mark the halfway point of the pattern using the Horizontal Line tool and set alerts there to monitor partial declines or rises.
Honest Limitation
TakeProfit does not have automatic pattern recognition for megaphone patterns. You must draw the trendlines manually and calculate the measured move yourself (or use the Long-Short Tool to plan the trade). The platform’s pattern tools cover harmonic patterns (XABCD, Cypher) and triangle patterns, but not broadening formations specifically. This means the pattern identification step depends entirely on your visual analysis.
For more details on setting alerts, see the TakeProfit Docs — Alert Trigger Criteria.
FAQ — Megaphone Pattern
Is a megaphone pattern bullish or bearish?
Neither inherently. The pattern is a volatility expansion signal; the direction depends on which trendline price breaks. Upward breakouts happen 60% of the time (Bulkowski, July 2025).
What is a descending megaphone pattern?
A descending broadening wedge is a megaphone tilted downward — both trendlines slope lower. Breakouts are upward 72% of the time. This is a distinct pattern from the standard broadening top.
How do you confirm a megaphone pattern breakout?
Price must close above the upper trendline (bullish) or below the lower trendline (bearish). Rising volume on the breakout candle adds confirmation. Throwbacks (67% rate) often retest the trendline.
What is the success rate of the megaphone pattern?
Published failure rates are 16–18% for upward breakouts and 26–27% for downward breakouts (Bulkowski, bull market samples). It ranks near the bottom third of chart patterns by performance.
Can you trade the megaphone pattern intraday?
Yes, on 15-minute or hourly charts. The same identification rules apply, but intraday patterns form faster and produce smaller measured moves. Shorter timeframes increase false breakout risk.
What causes a megaphone pattern to fail?
Common failure modes include forming after a long-term trend (exhaustion), tall/steep patterns that never reach their targets, and throwbacks that turn into full reversals.
This content is for educational purposes only and does not constitute investment advice. Past performance is not indicative of future results.
Get started with TakeProfit’s trading tools: TakeProfit Docs