Last updated: October 2026
Disclosure: The section on tracking the pattern uses TakeProfit‘s charting tools as a worked example; other charting platforms offer comparable drawing tools and price alerts.
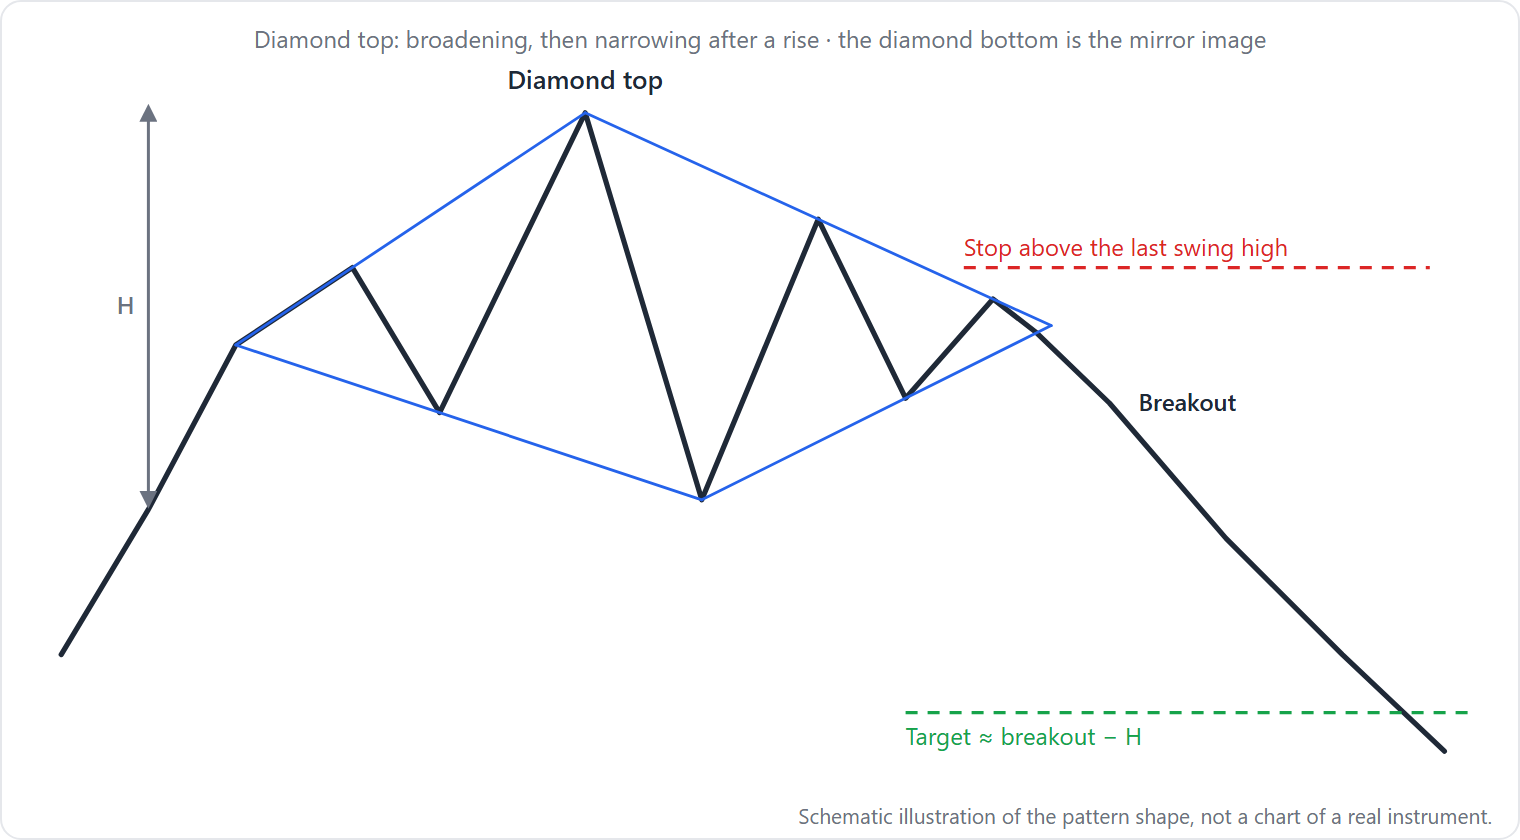
Quick answer: The diamond pattern is a reversal chart pattern that starts with a broadening phase (higher highs, lower lows) and narrows into a symmetrical triangle, forming a diamond outline. It signals a trend reversal in the direction of the breakout, confirmed when price closes outside one of the converging trendlines.
At a Glance
| Attribute | Diamond Top | Diamond Bottom |
|---|---|---|
| Type | Reversal | Reversal |
| Signal direction | Bearish | Bullish |
| Where it forms | After an uptrend | After a downtrend |
| Typical duration | Varies; best with leading trends <3 or 3–6 months (Bulkowski) | Same |
| Confirmation | Close below lower trendline | Close above upper trendline |
| Entry trigger | Close below breakout line | Close above breakout line |
| Stop placement | Beyond opposite trendline or recent swing high | Beyond opposite trendline or recent swing low |
| Target method | Pattern height projected from breakout | Pattern height projected from breakout |
| Most common failure | False breakout / throwback | False breakout / throwback |
All identification and statistical cells are based on Bulkowski’s diamond-top and diamond-bottom pages (thepatternsite.com, July 2025) unless noted otherwise.
What Is the Diamond Pattern and How Do You Identify It?
The diamond pattern consists of two phases. In the first, price forms a broadening formation with at least two higher highs and two lower lows. In the second, price narrows into a symmetrical triangle with lower highs and higher lows. Trendlines connecting these swing points create a diamond shape.
Identification Checklist
-
Prior trend is required. For a diamond top, price must be in a clear uptrend before the pattern begins. For a diamond bottom, the prior trend must be downward (Bulkowski, thepatternsite.com, July 2025).
-
Broadening phase. You need at least two higher peaks and two lower valleys. This phase reflects expanding volatility and disagreement between buyers and sellers.
-
Contracting phase. After the broadening phase, price makes lower highs and higher lows, converging into a symmetrical triangle. The combination of the two phases creates the diamond outline.
-
Trendline touches. Each of the four trendlines (upper left, lower left, upper right, lower right) should be touched by price at least once, and usually twice. Bulkowski notes, “Prices will touch each trendline once or twice. Don’t worry if your lines cross some of the price outliers” (thepatternsite.com, July 2025).
-
Shape is often tilted. Do not expect a perfect equilateral diamond. Bulkowski states the pattern “looks like a diamond, but one usually tilted to the side”. This tilt makes manual identification subjective.
-
Volume typically declines. For diamond tops, volume trends downward 55% to 59% of the time. For diamond bottoms, a falling volume trend occurs 67% of the time. Volume often peaks during the broadening phase and contracts as the pattern matures.
Why Does the Diamond Pattern Form?
The standard interpretation rests on the battle between buyers and sellers. The broadening half represents increasing disagreement and volatility as late buyers and early sellers clash, causing widening ranges. The contracting half shows the market narrowing into a decision—both sides exhaust their energy, and volatility shrinks. The eventual breakout reveals which side has dominated (Bulkowski, thepatternsite.com, July 2025).
Bulkowski adds a critical nuance: “price must have something to reverse” (thepatternsite.com, July 2025). If the prior move is too small, the reversal may lack momentum. This is why diamond patterns work best after a strong, clear impulse—either a quick rise (top) or a quick drop (bottom).
How Do Traders Trade the Diamond Pattern?
Traders follow a three-step plan after identifying the pattern: entry, stop, and target.
Entry. Wait for a close beyond the breakout trendline. For a diamond top, that means a close below the lower right trendline. For a diamond bottom, a close above the upper right trendline. Some traders enter on a confirmed close (e.g., one full candle beyond the line), while others use an intraday break if volume is strong. The exact convention varies.
Stop. Place your stop beyond the opposite side of the diamond—above the most recent swing high for a short trade, or below the most recent swing low for a long trade. If that distance is too wide relative to your risk tolerance, a fixed percentage (5–7% of entry price) can be used instead.
Target. Measure the vertical height of the diamond from the highest peak (A) to the lowest valley (B) inside the pattern. Subtract that height from the breakout price for a downward target; add it for an upward target (Bulkowski, thepatternsite.com, July 2025). This is the measured move projection.
Worked Example (Illustration)
Consider a diamond top on a daily chart for stock XYZ at a current price of $100.
- Highest peak inside the diamond: $112
- Lowest valley inside the diamond: $104
- Pattern height = $112 – $104 = $8
Price breaks below the lower trendline and closes at $106.
Target: $106 – $8 = $98
Stop: Place the stop above the most recent high, say at $113.
Risk: $113 – $106 = $7
Reward: $106 – $98 = $8
Risk/Reward ratio: 1.14
The trade risks $7 to make $8. Note that actual stop and target levels are hypothetical; real trading requires adjusting for slippage and volatility.
What Does the Evidence Say About Diamond Patterns?
The most comprehensive empirical work comes from Thomas Bulkowski’s database. His results are based on manual identification of perfect trades.
Diamond tops. Bulkowski analyzed 733 perfect trades (thepatternsite.com, July 2025). Downward breakouts occurred 54% of the time. Volume trended downward 55% to 59% of the time. Diamond tops with upward breakouts in a bull market “rank last for performance” (Bulkowski, thepatternsite.com, July 2025). For best results, look for breakouts in the lowest third of the yearly price range.
Diamond bottoms. Bulkowski analyzed 477 perfect trades. Upward breakouts occurred 74% of the time. Volume trended downward 67% of the time. Diamond bottoms are “most often found in a bull market with an upward breakout”. Avoid patterns with breakouts near the yearly high.
General limitations. No peer-reviewed academic study specifically testing diamond patterns was found in the public literature. Because the shape is often tilted and subjective, two analysts may draw different diamonds on the same chart. No credible study provides a universal win rate or risk-reward ratio beyond Bulkowski’s target-attainment percentages.
When Does the Diamond Pattern Fail?
Three specific failure modes occur frequently.
-
False breakout. Price breaks the trendline but reverses back into the diamond within one or two bars. This often happens in a range-bound market where no strong prior impulse exists. On the chart, you see a candle that closes beyond the line, but the next candle opens inside the pattern again. The trade should be exited immediately if the stop is hit or if price re-enters the diamond.
-
Throwback after breakout. Price moves away from the breakout level for a few bars, then returns to test the trendline (sometimes penetrating it briefly). This pullback can stall the move or lead to a full reversal. Bulkowski notes that throwbacks and pullbacks “hurt post breakout performance” (thepatternsite.com, July 2025). A throwback is normal if price holds the trendline and resumes, but if it fails to continue after the retest, the pattern is likely failing.
-
Early reversal before the contracting phase completes. The pattern never forms the symmetrical triangle; price gaps or breaks out prematurely from the broadening phase. This can occur on a sudden news catalyst. On the chart, you see a wide-ranging candle that crosses a trendline before the narrowing phase begins. The diamond is incomplete, and the breakout should not be trusted.
Look-Alikes: How to Tell Diamond from Other Patterns
| Pattern | How It Differs from Diamond | Where to Read More |
|---|---|---|
| Head and Shoulders | Has three distinct peaks (left shoulder, head, right shoulder) with a neckline, not a two-phase broadening-then-contracting structure. | See the head and shoulders explainer for full differentiation. |
| Symmetrical Triangle | Only has a narrowing phase (lower highs, higher lows). A diamond always begins with a broadening phase before the triangle. | Covered in a future encyclopedia entry. |
| Broadening Formation | Has only widening highs and lows; no contracting phase follows. Diamonds include both expansion and contraction. | Covered in a future encyclopedia entry. |
| Wedge | Trendlines slope in one direction (rising wedge or falling wedge). Diamond trendlines diverge then converge and are often tilted rather than directionally sloped. | See separate wedge page when published. |
| Rectangle | Price moves between two parallel horizontal lines, not diverging/converging trendlines. | Not a direct look-alike for experienced traders. |
How to Track the Diamond Pattern on a Chart in TakeProfit
TakeProfit does not automatically detect diamond patterns. You must manually draw the structure using the platform’s line and measurement tools.
-
Drawing the pattern. Use the Standard Line tool (Alt+T) to draw the four trendlines: two for the broadening phase (connecting higher peaks and lower valleys) and two for the contracting phase (connecting lower peaks and higher valleys). You can also use Ray lines if you want the trendlines to extend infinitely.
-
Measuring the height. Use the Date & Price tool or Price Only tool to measure the vertical distance between the highest peak and the lowest valley inside the diamond. This gives you the pattern height for the target calculation.
-
Setting a reference level. Once you have identified the breakout level (e.g., the lower trendline for a top), draw a Horizontal Line (Alt+H) at that price. You can then create a manual alert on that level using the platform’s alert system (not covered here).
-
Evaluating risk/reward manually. Use the measured height and the stop level to calculate the risk-reward ratio by hand. TakeProfit does not provide a built-in tool that automatically computes risk-reward for manually drawn patterns.
Limitation: TakeProfit relies on your manual drawing—the pattern is not recognized automatically. The platform’s pattern tools (head and shoulders, triangle, etc.) do not include diamond, so you are responsible for correctly identifying the broadening and contracting phases.
Frequently Asked Questions
Is a diamond pattern bullish?
It depends on the type. A diamond bottom (after a downtrend) signals a bullish reversal. A diamond top is bearish (Bulkowski, thepatternsite.com, July 2025).
What is the most successful trading pattern?
No single pattern is “most successful.” In Bulkowski’s rankings, head and shoulders and double tops/bottoms often outperform diamonds in certain metrics.
What is the 3-5-7 rule in trading?
That rule is unrelated to diamond patterns. It is a candlestick or entry rule not covered here.
Is diamond trading profitable?
Profitability depends on your risk management, position sizing, and market context. No universal win rate has been published for diamond patterns.
What is the best diamond pattern?
“Best” is subjective. Bulkowski suggests diamonds with a strong prior trend and breakout in the reversal direction tend to perform better (thepatternsite.com, July 2025).
This article is for educational purposes only and does not constitute investment advice. Past performance is not indicative of future results.