Last updated: October 2026
Disclosure: The section on tracking the pattern uses TakeProfit‘s charting tools as a worked example; other charting platforms offer comparable drawing tools and price alerts.
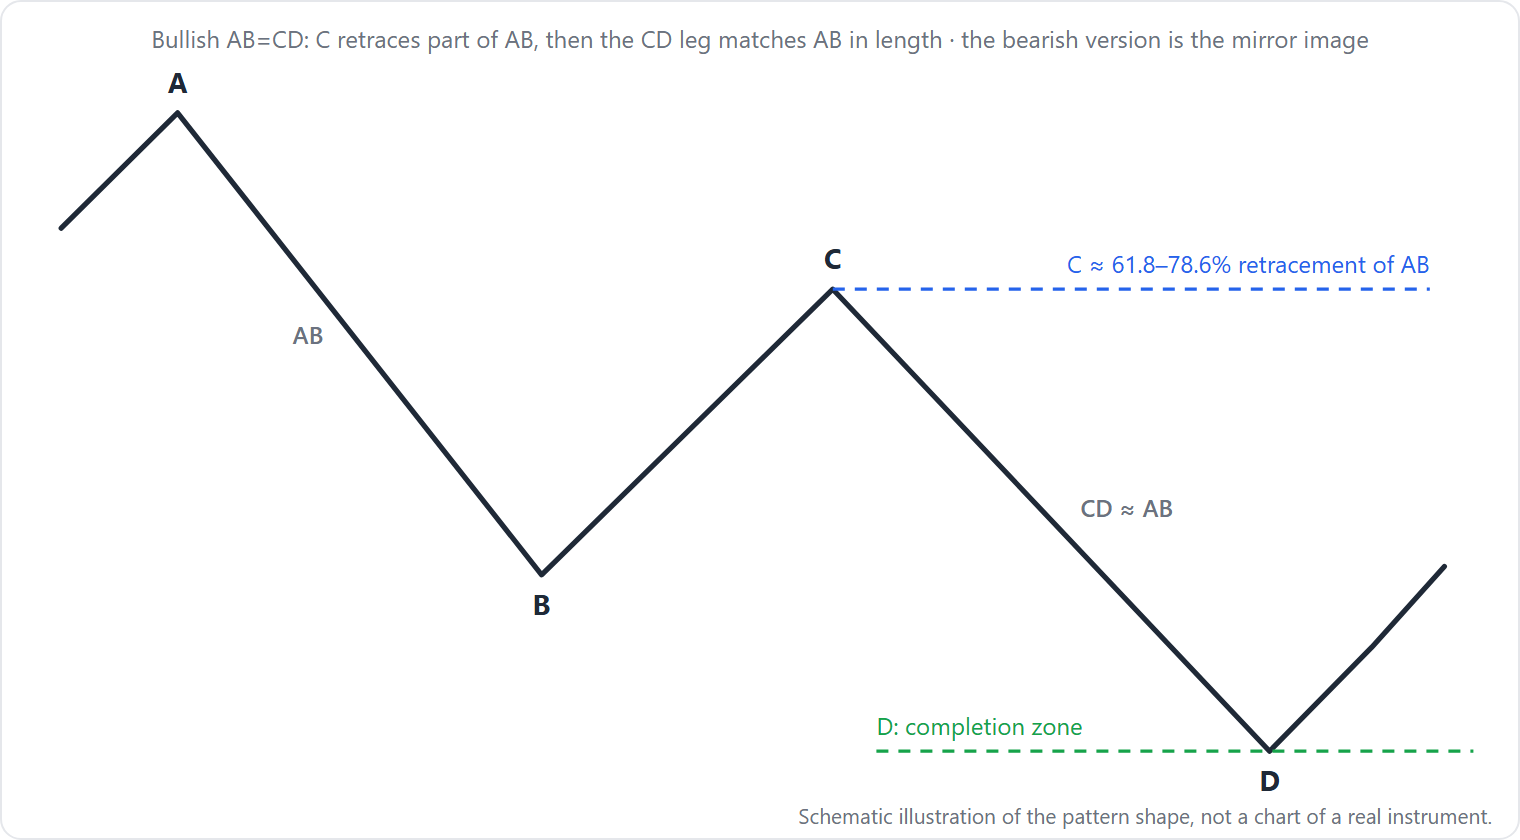
Quick answer: The ABCD pattern is a four-point harmonic chart pattern (A, B, C, D) formed by three price swings where the CD leg often equals AB by price. It signals a potential reversal when CD completes at a Fibonacci projection of BC, but research shows price turns at D only 32–38% of the time.
At a glance – key facts
| Attribute | Bullish ABCD | Bearish ABCD |
|---|---|---|
| Type | Reversal (after downtrend) | Reversal (after uptrend) |
| Signal direction | Up | Down |
| Where it forms | End of a measured move down, using Fibonacci turns | End of a measured move up, using Fibonacci turns |
| Typical timeframe | Any (Bulkowski tested daily data) | Any |
| Confirmation | Price breaks above point B | Price breaks below point B |
| Entry trigger | Buy at D after reversal candle | Sell short at D after reversal candle |
| Stop placement | Below point C (or below D by buffer) | Above point C (or above D by buffer) |
| Target method | AB=CD equality; or Fibonacci projection | AB=CD equality; or Fibonacci projection |
| Most common failure | Price continues down past D (~62% of bullish cases, per Bulkowski) | Price continues up past D (~68% of bearish cases, per Bulkowski) |
Note: The turn rates (38% bullish, 32% bearish) are from Bulkowski’s study of at least 1,741 perfect bullish and 2,649 perfect bearish trades (Bulkowski, thepatternsite.com, August 2020). No volume or time symmetry requirements are part of the definition.
How to identify the ABCD pattern – numbered checklist
-
Swing legs: Locate three consecutive price swings: AB, BC, CD. Points A, B, C, D must be alternating swing highs and lows (Bulkowski, thepatternsite.com, August 2020). The peaks and valleys need not be consecutive bars—an observation, not a strict rule.
-
BC retracement: Measure the BC leg as a percentage of AB. For a valid pattern, this percentage must be one of: 38.2%, 50%, 61.8%, 70.7%, 78.6%, or 88.6%. Bulkowski used a 1% tolerance for closeness. If the retrace falls outside this set (e.g., 55%), the pattern is invalid.
-
CD projection: The CD leg as a percentage of CB must be one of: 113%, 127%, 141%, 161.8%, 200%, 224%, 261.8%, or 314%. Again, a 1% tolerance applies. Bulkowski excluded 314% and 224% from the reciprocal calculation method because they are not reciprocals of any ABC retrace ratio.
-
AB=CD equality (optional): Many traders require that CD approximately equals AB in price length. To predict point D, subtract the AB length from price at C (bullish) or add it (bearish). This is called the measure rule.
-
No other restrictions: The pattern can form in any market (stocks, forex, crypto) and on any timeframe. No volume, moving average, or time symmetry filter is required by the definition.
Why the ABCD pattern forms – crowd-behavior interpretation
The pattern is interpreted as recurring crowd behavior. The initial move (AB) represents strong directional conviction. The retracement (BC) shows profit-taking and counter-trend traders entering, pausing the trend. The final surge (CD) occurs as the original trend resumes with renewed force, often exhausting at a Fibonacci level where opposition traders step in (FBS, 2018–2026; thinkorswim, 2026). This interpretation is standard in harmonic trading literature but remains subjective—no proven mechanism explains why price should reverse at D with any consistency.
How traders trade the ABCD pattern – entry, stop, target conventions + worked example
Entry: Wait for point D to form. Some traders enter on the close of the candle that confirms D (e.g., a bullish reversal candle for bullish ABCD). Others wait for price to break above point B (bullish) or below point B (bearish) for additional confirmation.
Stop: Place the stop below point C for bullish entries; above point C for bearish entries. Alternatively, use a fixed buffer of 1–2% beyond D.
Target options:
– AB=CD equality: Measure the AB leg and project it from point C. For bullish ABCD: D target = C price – AB length. For bearish: D target = C price + AB length.
– Fibonacci projection: Multiply the BC leg by the reciprocal of the BC retrace ratio and add/subtract from C.
– Bulkowski’s enhanced measure rule: Use the next higher Fibonacci number in the formula for increased accuracy (Bulkowski, thepatternsite.com, August 2020).
Illustration – Bearish ABCD on hypothetical stock XYZ:
- A = $50 (low)
- B = $70 (high) → AB leg = $20 up
- C = $60 (low) → BC leg = $10 down. Retrace % = 10/20 = 50% (valid, within 1% of 50%)
- D projection using AB=CD: CD should equal AB = $20. Add to C: D = $60 + $20 = $80.
- Entry: Sell short at $80 on a bearish reversal candle. Stop at $72 (above C, or above B at $71). Target: $50 (point A).
The arithmetic is correct: AB=20, retrace 50% valid, D = C + AB = $80.
What the evidence says – sourced statistics
The only large-sample study publicly available is by Thomas Bulkowski (thepatternsite.com, updated August 2020). Based on at least 1,741 perfect bullish trades and 2,649 perfect bearish trades (daily data, period prior to 2020):
Bullish AB=CD (measured move down):
– Price reaches point D 100% of the time.
– The stock turns upward at D only 38% of the time.
– After turning, price rises to A 40% of the time, to B 83%, to C 47%.
Bearish AB=CD (measured move up):
– Price reaches point D 95% of the time in a bull market.
– Turns downward at D only 32% of the time.
– Price continues rising past D 68% of the time.
– After turning, price falls to A 24% of the time, to B 76%, to C 35%.
All statistics from Bulkowski, thepatternsite.com, August 2020.
Critical limitation: These are “perfect trades”—patterns that already fit the Fibonacci ratios perfectly. Real-time identification with a 1% tolerance may lower performance. No other academic or large-sample study was found for the ABCD pattern. Readers should test the pattern on their own historical data before committing capital.
When the ABCD pattern fails – three specific failure modes
-
Price continues through D without reversal (most common). Condition: a strong prevailing trend overpowers the potential reversal. Chart shows CD leg extending past the projected D level without any price pause. Occurs about 62% of the time in bullish patterns and 68% in bearish patterns (Bulkowski, thepatternsite.com, August 2020).
-
Price reverses at D but fails to reach target A. Condition: low momentum or nearby support/resistance stalls the move. Chart shows a weak bounce (bullish) that turns before reaching point A, often creating a lower high instead of a full retracement to A.
-
BC retracement is not a clean Fibonacci ratio. Condition: choppy, sideways market. Chart shows BC retracing AB by a percentage not within 1% of any allowed ratio (38.2%, 50%, 61.8%, 70.7%, 78.6%, 88.6%). The pattern is invalid from the start.
Look-alikes – comparison table
| Feature | ABCD (this page) | Gartley (future page) | Bull/Bear Flag (sibling page) |
|---|---|---|---|
| Number of points | 4 (A,B,C,D) | 5 (X,A,B,C,D) | N/A (trend channel) |
| Retracement at C | One of 6 Fibonacci ratios (38.2–88.6%) | Typically 61.8–78.6% of both XA and AB | N/A – flag is a consolidation |
| CD length | Equal to AB or Fibonacci projection | Usually 1.272–1.618 of AB | N/A – flag pole = AB |
| Reversal vs continuation | Reversal after trend | Reversal after trend | Continuation |
| Key distinguishing sign | No X point before A | Has X point, and D does not exceed X | Parallel channel after sharp move |
For more on flags, see the bull flag / bear flag explainer. The Gartley and other XABCD patterns will be covered in a future article.
Tracking the ABCD pattern on a chart in TakeProfit
TakeProfit provides an ABCD Pattern drawing tool (under Pattern tools) that lets you place four control points (A, B, C, D) manually on swing highs and lows. The tool automatically calculates and displays the ratio of CD to BC between points B and D.
Practical steps:
– Open a chart and select the ABCD Pattern tool from the toolbar.
– Click at point A (swing low for bearish ABCD, swing high for bullish), then B, then C, then D. The tool draws the legs and shows the projection ratio.
– Use the Horizontal Line or Horizontal Ray to mark entry, stop, and target levels.
– To set an alert, right-click the level line and choose “Alert” — set a condition for price crossing the level. The alert triggers once per bar; you can configure re-triggering in Advanced Settings.
– Use the Long-Short Tool (Alt+L) to plan the trade: position the entry line at D, stop line beyond C, take-profit line at A (or B). The tool calculates risk/reward ratio.
Limitation: TakeProfit does not automatically scan for ABCD patterns. The ABCD drawing tool is a manual helper—you must visually identify the swings and place the points yourself. The tool displays the CD/BC ratio, but you must check that it matches one of the allowed Fibonacci values. No automatic pattern validation is included.
FAQ
What is the most successful trading pattern? No single pattern has a guaranteed success rate. The ABCD pattern reverses at D only 32–38% of the time (Bulkowski, 2020). No pattern is “most successful” across all markets and timeframes.
How to identify an ABCD pattern? Look for three consecutive price swings (AB, BC, CD) where the BC retrace is a Fibonacci ratio (38.2%–88.6% of AB) and CD aligns with a Fibonacci projection of BC. Use the 1% tolerance rule.
How to draw an ABCD pattern? Connect four swing points A→B→C→D in order. Use the Fibonacci retracement tool to check BC as a % of AB, and the Fibonacci extension tool to check CD as a % of BC. In TakeProfit, use the ABCD Pattern drawing tool.
What is the harmonic pattern ABCD? ABCD is the simplest harmonic pattern, based on Fibonacci ratios between three legs. It serves as the building block for more complex patterns like the Gartley, which adds an X point before A.
What is the 3-5-7 rule in trading? The 3-5-7 rule is a different price/time projection method used by some swing traders, not directly related to the ABCD pattern.
This article is for educational purposes only. Past performance is not indicative of future results. Trading involves risk and may not be suitable for all investors.
Related patterns: Ascending and descending channels, Double top and double bottom.
Learn how to use the ABCD pattern drawing tool in TakeProfit: Pattern Tools Documentation