Last updated: September 2026
Disclosure: The section on tracking the pattern uses TakeProfit’s charting tools as a worked example; other charting platforms offer comparable drawing tools and price alerts.
Quick answer: In technical analysis, the hammer candlestick pattern is a single‑candle bullish reversal signal that appears after a decline. The hammer candle has a small body near the top, a long lower shadow at least twice the body, and little or no upper shadow. Many traders wait for a close above the hammer’s high before acting (StockCharts ChartSchool; Axi).
At a glance — key facts
| Attribute | Detail |
|---|---|
| Type | Bullish reversal, valid after a decline/downtrend (StockCharts ChartSchool) |
| Signal direction | Up, typically on confirmation via break/close above the high (Axi) |
| Where it forms | After a decline or downtrend; the same shape in an uptrend is a hanging man (Investopedia) |
| Candle geometry | Small body near the top; long lower shadow ≥2× body; little or no upper shadow; body color is not required for definition (FOREX.com; StockCharts ChartSchool) |
| Typical duration/timeframe | Single candle; used across timeframes (FOREX.com) |
| Confirmation | Close above the hammer’s high before acting (TradingMetrics) |
| Entry trigger | Break/close above the hammer high (Axi) |
| Stop placement | Below the hammer low (invalidation) (Axi) |
| Target method | Measured move (project candle height) or aim for nearby resistance (Axi) |
| Common failures | No prior downtrend; immediate new low after the hammer; choppy ranges that whipsaw confirmations (Investopedia) |
| Evidence snapshot | Bulkowski’s tests on U.S. stocks: acts as a bullish reversal ~60% of the time; overall performance rank mid‑pack (ThePatternSite) |
The hammer candlestick pattern — how to identify it
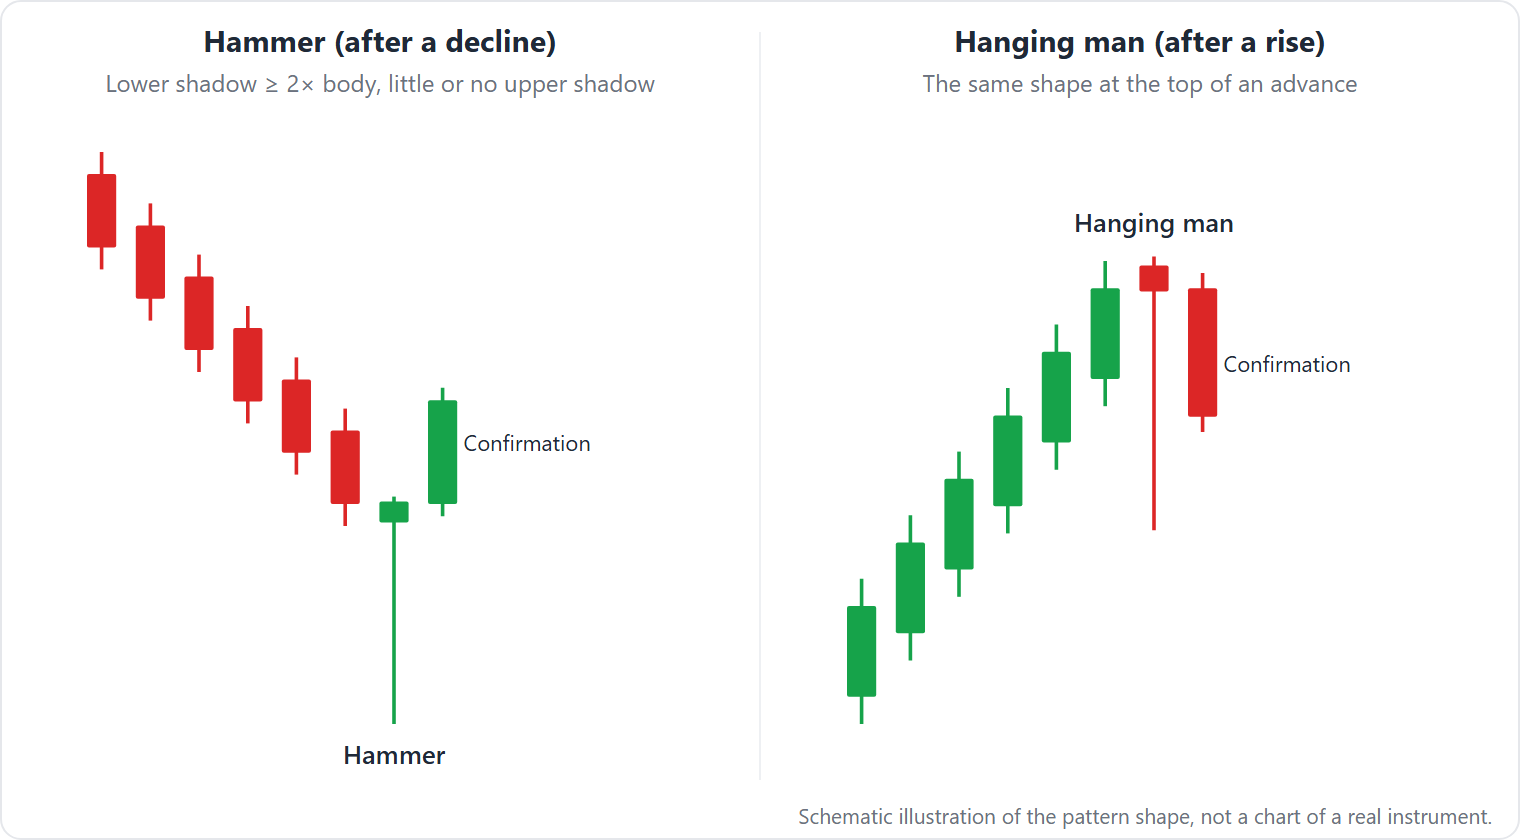
The hammer is a single candle with a long lower shadow that forms after a decline and signals a potential bullish reversal among candlestick patterns.
Use this checklist:
– Context: It should appear after a downtrend; without a prior decline, it is not a bullish reversal signal (StockCharts ChartSchool).
– Body: A small real body sits near the top of the candle’s range; body color is not required for definition (StockCharts ChartSchool).
– Lower shadow: The lower shadow is at least twice the body; some educators look for 2–3× as stronger examples (FOREX.com).
– Upper shadow: Little or no upper shadow; the close should be near the session high (FOREX.com; Axi).
– Optional strength factors: Confluence with support, oversold indicators, and higher timeframes can help, but they are not definitional (Investopedia).
Practical identification steps on a chart:
– First, scan for a visible downswing (lower highs and lower lows). None of the cited sources publish a numeric threshold for “downtrend,” so a visual decline into the candle is the working filter (Investopedia).
– Next, check the geometry. If the lower shadow is not at least 2× the real body, it fails the strict hammer definition here and is best treated as a generic long‑lower‑shadow candle, not a classified hammer (see “look‑alikes”).
– Then, check the top of the candle. A very small upper wick is acceptable, but the close should be near the session high so that the body sits toward the top of the range (FOREX.com).
– Finally, remember that body color is not part of the definition. A red or green body can both qualify; confirmation rules address momentum rather than body color (StockCharts ChartSchool; Axi).
Where sources diverge: most specify “≥2× shadow‑to‑body,” while some suggest “ideally 2–3×.” All require a prior decline; none provide a numeric definition of “downtrend” (FOREX.com; Investopedia).
The hammer candlestick pattern — why it forms
The hammer shows sellers pushing to new intraperiod lows and buyers rejecting those lows into the close, leaving a long lower shadow and a small body near the top. After a decline, that rejection is read as possible seller exhaustion and emerging demand; many sources call for confirmation in subsequent candles (StockCharts ChartSchool; Investopedia).
In other words, the candle compresses a test‑and‑rejection sequence into a single bar: price probes lower (capturing liquidity from stops or late shorts), demand absorbs that supply, and the session finishes near the high, signaling a potential shift in control. The minimal upper wick reinforces that buyers kept control into the close, while the long lower shadow documents the failed push by sellers (StockCharts ChartSchool; Investopedia).
The hammer candlestick pattern — how traders trade it
The hammer pattern is commonly traded with confirmation. Typical trading strategies include:
- Entry: Wait for a close above the hammer’s high to confirm a potential momentum shift (Axi).
- Stop: Place a protective stop just below the hammer’s low; a breach typically invalidates the setup (Axi).
- Targets:
- Measured move: Project the candle’s height from the breakout as a first target (per ThePatternSite).
- Structure: Use nearby resistance or prior swing highs (Axi). For a multi‑candle trigger, some use a bullish engulfing bar (see Bullish and Bearish Engulfing pattern).
Aggressive traders sometimes enter on an intrabar break above the high rather than waiting for a closing confirmation; this increases false‑break risk and the chance of immediate stop‑outs if price fades back below the high (Investopedia).
Illustration:
– Suppose a hammer prints with low 98.00, high 100.00, close 99.80 on a daily chart after a clear decline. Here “clear decline” means a visible sequence of lower highs and lower lows; no numeric threshold is published by the cited sources.
– The next day closes at 100.20, above the high.
– Entry = 100.20 (confirmation close).
– Stop = 97.95 (a few cents below 98.00). Risk per share = 100.20 − 97.95 = 2.25.
– Candle height = 100.00 − 98.00 = 2.00. Measured‑move target = 100.20 + 2.00 = 102.20. Risk‑reward ≈ 2.00 / 2.25 = 0.89.
– Alternatively, if next resistance is 104.50, target = 104.50. Risk‑reward ≈ (104.50 − 100.20) / 2.25 = 4.30 / 2.25 ≈ 1.91.
The hammer candlestick pattern — what the evidence says
Thomas Bulkowski’s tests on U.S. stocks report that the hammer acts as a bullish reversal 60% of the time (reversal rank 26/103) and its overall post‑breakout performance ranks 65/103. Bulkowski also reports a “best” target‑meeting rate of 88% for a measured move in bull‑market up breakouts. In bear markets after downward breakouts, he reports a best average 10‑day move of −4.12% (rank 48/103). Sources: ThePatternSite, Hammer and his book, Encyclopedia of Candlestick Charts (Wiley, 2012).
Context notes for readers:
– What his “60% reversal” measures: Bulkowski classifies the subsequent direction after the pattern under his test definitions; the online summary does not state that a separate confirmation candle was required.
– Sample and period: the online summary describes “hundreds of perfect trades” across bull/bear and up/down breakouts. Specific securities and years are not published on the summary page; details are in the 2012 Wiley book’s hammer chapter.
– Interpretation: Bulkowski cautions that 60% is “not far from random (50%),” and that average post‑breakout travel is modest relative to other candlestick patterns.
Independent, peer‑reviewed, hammer‑specific studies are not cited in the current source set. Practitioner guidance therefore emphasizes confirmation and multi‑factor confluence rather than relying on the hammer alone (Investopedia).
The hammer candlestick pattern — when it fails
Common failure modes and what you’ll see:
– No prior downtrend: A hammer‑shaped bar in mid‑range is not a reversal signal; price often drifts or continues lower. On the chart: a long‑wick candle inside a sideways move, with no sequence of lower lows and lower highs (StockCharts ChartSchool; Investopedia). A quick diagnostic is to zoom out one or two timeframes: if the “hammer” sits in the middle of a range or after an upswing, the context filter fails and the label should not be applied.
– Immediate new low: The next candle breaks or closes below the hammer low. Visually, the invalidation line at the low is pierced early; the long lower shadow did not mark exhaustion, and continuation resumes (FOREX.com). On confirmation‑based plans, this typically prevents entry; on aggressive intrabar entries, it quickly stops out.
– Range chop or thin trade: Alternating long‑wick candles whipsaw confirmations. You’ll see multiple opposing tails and small bodies, often without volume pickup on confirmation (Investopedia). Look for repeated closes back inside the hammer’s range after temporary breaks above the high; this price action warns that the breakout lacks follow‑through.
– News gaps: A scheduled catalyst gaps price below the hammer low, turning a candidate bottom into continuation (Investopedia). These failures are visible as a gap‑down open that skips through the invalidation level before any confirmation can occur.
The hammer candlestick pattern — look‑alikes and how to tell them apart
| Pattern | How it differs | Where to read more |
|---|---|---|
| Hanging man | Same shape but in an uptrend; interpreted as a bearish warning. | Bulkowski’s page on the pattern: ThePatternSite — Hanging Man |
| Dragonfly doji | Open ≈ close at the top (virtually no body); T‑shape with long lower shadow. Hammers have a small but visible body. | Overview: Commodity.com — Dragonfly Doji |
| Inverted hammer | Mirror image: long upper shadow, little/no lower shadow. Bullish after a decline; same shape at a top is a shooting star. | See Shooting Star candlestick (incl. inverted hammer) |
| Long lower‑shadow candle (generic) | Fails the 2× rule, has a larger body, or appears without a prior downtrend; not a classified hammer. | See identification rules above |
Quick checks to separate look‑alikes:
– Ask “What was the preceding trend?” The same candle after an advance is a hanging man, not a hammer.
– Ask “Is the real body almost zero?” If open ≈ close at the top, it’s a dragonfly doji; a hammer requires a small but visible body.
– Measure the lower shadow. If it is less than twice the body, treat it as a generic long‑lower‑shadow candle rather than a hammer.
The hammer candlestick pattern — tracking it in TakeProfit
Neutral how‑to with platform tools:
– Measure the candle. Use Quick Measure or Price Only to read the hammer’s height (high–low). Then add it to the breakout level for a measured‑move target. See docs: TakeProfit docs: measurement tools.
– Model the trade. Use the Long‑Short Tool to set entry at or above the hammer high. Then set a stop below the low and add multiple targets. The tool displays live risk/reward and the distance to each take‑profit.
– Add confluence. Optionally drop an Anchored VWAP from the hammer bar to monitor acceptance above the reversal point (covered in the same measurement toolkit).
– Set alerts. Create alert(s) at the confirmation level (hammer high) and at the invalidation level (hammer low) so you can wait for confirmation without watching every tick. See: TakeProfit docs: alerts overview.
Limitations and transparency:
– The Long‑Short Tool is a planner, not an order; nothing is sent to an exchange (per the docs above).
– Automatic recognition of the hammer pattern is not published in the docs; you set the levels yourself.
– Alerts watch levels and conditions you define; they do not “recognize” candlestick patterns.
– TakeProfit has a free plan with limits (for example, free users get 1 alert with up to 3 months of expiration, per the alert limitations docs); higher limits require a paid plan.
The hammer candlestick pattern — FAQ
-
Is a hammer bullish or bearish?
A hammer after a downtrend is treated as a bullish reversal pattern in candlestick patterns. The same geometry after an uptrend is labeled a hanging man with bearish implications (Investopedia — Hammer). -
Is a red hammer still bullish?
Yes. Body color is not part of the definition; shape and downtrend context matter. Many traders prefer to wait for a close above the high to confirm (Axi). -
Are the hanging man and hammer the same?
They share geometry but differ by context. In a decline it’s a hammer (bullish setup). In an advance it’s a hanging man (bearish warning) (ThePatternSite — Hanging Man). -
How do you identify a hammer?
Look for a small body near the top, a lower shadow at least twice the body, little or no upper shadow, and placement after a decline (FOREX.com).
This article is educational and not investment advice. To set price alerts at your confirmation and invalidation levels in TakeProfit, see the Alerts overview: TakeProfit docs: alerts overview