Last updated: September 2026
Disclosure: The section on tracking the pattern uses TakeProfit’s charting tools as a worked example; other charting platforms offer comparable drawing tools and price alerts.
Quick answer: A shooting star candle is a single‑bar bearish reversal pattern that appears after an advance: a small real body near the low, little or no lower shadow, and an upper shadow at least twice the body. Treat it as a warning within technical analysis and seek confirmation via a close below the candle’s low (Bulkowski; Investopedia).
At a glance — key facts
| Attribute | Detail |
|---|---|
| Type | Bearish reversal (single-candle) after an advance (StockCharts ChartSchool; Investopedia) |
| Signal direction | Bearish warning; confirmation recommended (StockCharts ChartSchool) |
| Where it forms | After an advance near recent highs/resistance level (Bulkowski; Investopedia) |
| Typical duration/timeframe | Single session; Bulkowski’s tests use daily U.S. stock data and his “perfect trades” backtest method (Bulkowski) |
| Confirmation | Commonly a close below the candle’s low; some accept a gap down or long bearish candle as alternatives (StockCharts ChartSchool) |
| Entry trigger | After a confirming close below the low; some use a trigger below the body (TradingView; Axi) |
| Stop placement | Just above the shooting star’s high (Axi; TradingView) |
| Target method | Next support/swing low or Fibonacci retracements; no canonical measured move (TradingView; Axi) |
| Common failure | No bearish confirmation and/or a break above the high; frequent in strong bullish trends (TradingView; StockCharts ChartSchool) |
How to identify the shooting star — the checklist
The shooting star pattern appears at the top of an uptrend and shows a small body near the low, a long upper shadow at least twice the body, and little or no lower shadow (Bulkowski; Investopedia). Body color can be either; a bearish close modestly strengthens the warning (Investopedia).
- Prior uptrend required. Major sources frame the shooting star as a bearish reversal “after an advance,” not a mid‑range candle (Bulkowski; StockCharts ChartSchool).
- Small real body near the session low; not a doji. Although it may resemble a gravestone doji, open and close are not equal (Bulkowski).
- Long upper shadow ≥ 2× body, a common threshold across candlestick patterns (Investopedia; TradingView).
- Little or no lower shadow (Bulkowski; Investopedia).
- Alternative numeric definitions exist. One peer‑reviewed test defines body ≤25% of the range and lower shadow ≤5%, implicitly forcing the upper shadow to be ≥70% of the bar (Jamaloodeen, Heinz, and Pollacia, “A Statistical Analysis of the Predictive Power of Japanese Candlesticks,” Journal of International & Interdisciplinary Business Research, 2018).
- Confirmation is separate from identification. Many traders require a subsequent close below the shooting star’s low before acting (TradingView).
- Gap requirement: none for the single‑line pattern. Bulkowski’s one‑line shooting star has no gap rule; his two‑line variant requires a body gap (Bulkowski — two‑line shooting star). Some platform libraries label a two‑candle gap‑up variant “shooting star,” which is non‑canonical (Thinkorswim).
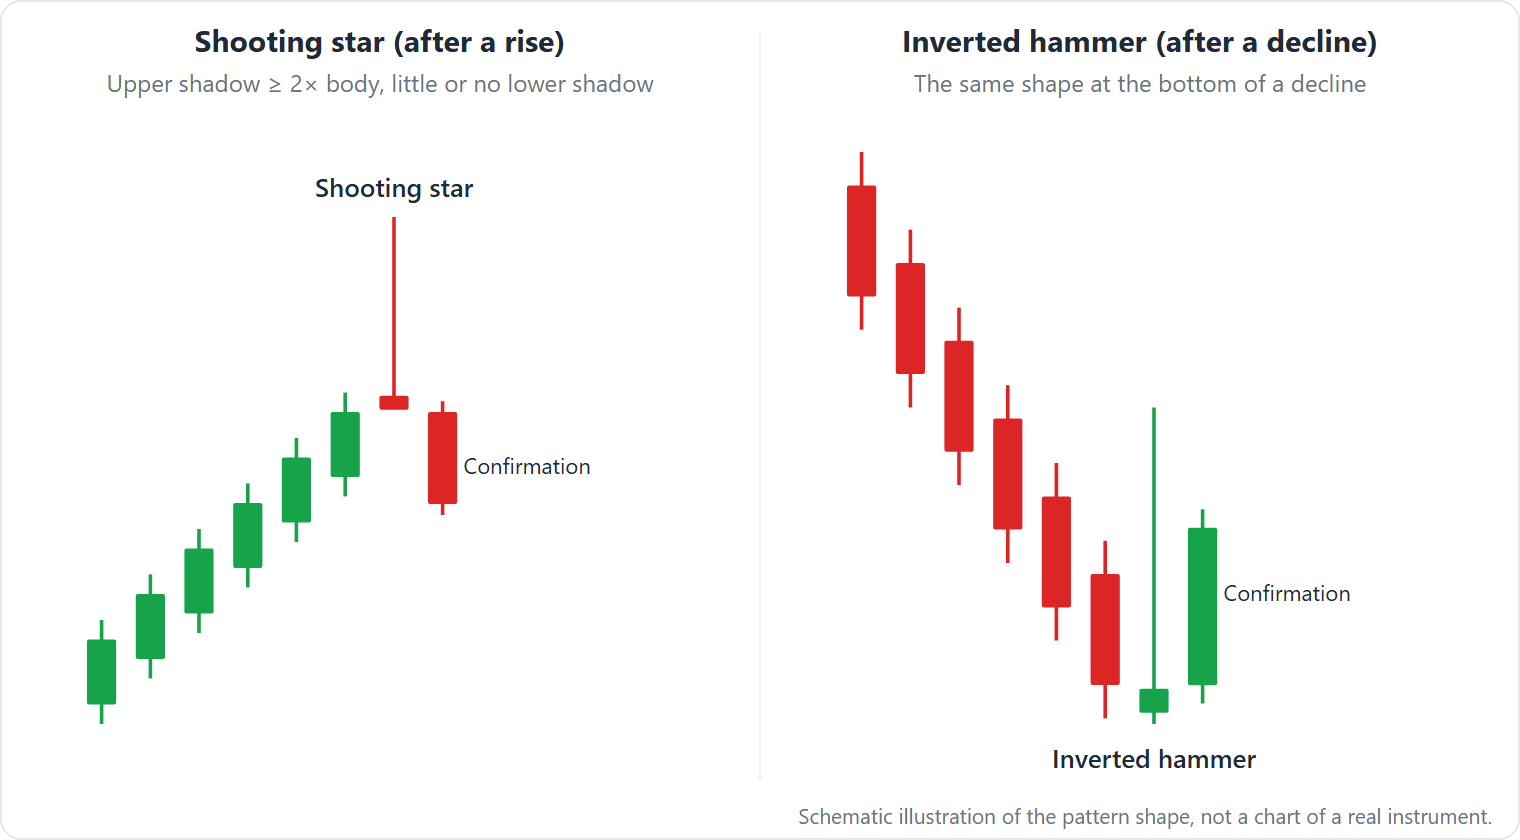
Also distinguish it from related chart patterns: hammer/hanging man have long lower shadows (see Hammer candlestick (incl. hanging man)), and gravestone doji has virtually no body (see Doji candlestick (incl. dragonfly and gravestone doji)).
Why the shooting star forms — interpretation
The shooting star records buyers pushing to new highs but failing to hold them; sellers or profit‑taking drag the close back near the open/low, leaving a long upper wick. Sources present it as a warning of fading momentum and potential resistance, not proof of a trend reversal (Investopedia; StockCharts ChartSchool).
Intraday, a common sequence is enthusiasm early (sometimes a strong open), extension to or through a recent high, and then sustained selling that erases most of the gain into the close. The long upper shadow visualizes that rejection of higher prices; the minimal lower shadow shows buyers did not mount a late‑session recovery to retest the highs. A bearish (red/black) close underscores that loss of control by finishing below the opening price, but body color alone does not confirm a reversal (Investopedia; StockCharts ChartSchool).
Context matters. Printing at established resistance or after a persistent run‑up highlights potential exhaustion; appearing mid‑range without a prior advance is not a textbook shooting star and carries less informational value. Because single candles are noisy, mainstream guides recommend pairing the pattern with trend and level analysis, then requiring confirmation on subsequent price action rather than acting on the candle alone (Investopedia; StockCharts ChartSchool).
How traders trade the shooting star — entries, stops, targets
The shooting star is typically traded on confirmation. Many wait for a close below the candle’s low; some use a trigger just below the body, while aggressive traders may use an intrabar break of the low, accepting higher whipsaw risk (TradingView; Axi).
- Entry: Wait for a close below the low (bearish confirmation). Some accept a gap down or a long black candle as alternatives (StockCharts ChartSchool).
- Stop: Place just above the shooting star’s high; a break there invalidates the rejection thesis (Axi).
- Targets: Use nearest support/swing low or Fibonacci retracements; candlestick patterns do not provide a native measured move (TradingView; Axi).
Illustration (prices rounded to two decimals; numbers are illustrative, not a live trading strategy):
– Suppose a stock rallies to form a shooting star with high = 102.00, low = 98.00, open = 99.00, close = 99.50.
– Next bar closes at 97.90, below the 98.00 low. Entry = 97.90 (short).
– Stop goes just above 102.00; use 102.10. Risk (R) = 102.10 − 97.90 = 4.20.
– 1R target = 97.90 − 4.20 = 93.70.
– 2R target = 97.90 − 2 × 4.20 = 89.50.
– If price instead closes back above 102.10, the pattern thesis is invalidated at the stop level.
Practical refinements focus on location and structure. Many traders want the candle into prior swing highs or a well‑tested resistance level so the long upper wick represents a clear rejection at supply. After confirmation, trades are often managed toward the nearest support.
A common approach is partial profits at first support and leaving a remainder for deeper pullbacks (such as a halfway retracement into the prior swing) because there is no fixed measured move in this reversal pattern (StockCharts ChartSchool; TradingView; Axi). Those who favor closing‑basis signals will often wait for the session to finish to avoid intraday whipsaws, while those who trigger on breaks accept higher variance for earlier entries (StockCharts ChartSchool; TradingView).
Sizing and risk‑reward revolve around the stop above the high. With that invalidation defined, position size can be calibrated so that a full stop‑out equals a pre‑set risk unit. Targets expressed in R (for example, 1R at the first support, 2R at a deeper level) keep the plan consistent with the candle’s non‑measured nature. If price fails to follow through after confirmation and reclaims the shooting star’s high, the short thesis is considered null and the trade exited per the stop rule (Axi; TradingView).
What the evidence says — stats and critiques
On daily U.S. stock data, Thomas Bulkowski reports the single‑line shooting star “acts as a reversal 59% of the time,” based on his standardized “perfect trades” backtest methodology (as of 2026; Bulkowski). Bulkowski separately finds a two‑line, gap‑up variant behaves as a bullish continuation about 61% of the time and ranks 52 of 103 by his performance metric (as of 2026; Bulkowski — two‑line shooting star).
Academic testing is skeptical. Using a formal definition (body ≤25% of range; lower shadow ≤5%), Jamaloodeen, Heinz, and Pollacia find that shooting stars defined by closing prices predict 5–10‑day tops no better than random candles. Using the high as the local top improves peak detection significantly (Jamaloodeen, Heinz, and Pollacia, Journal of International & Interdisciplinary Business Research, 2018).
These contrasting results highlight that precise rules and reference points matter. Bulkowski’s catalog measures pattern behavior in daily U.S. equities using his entry/exit rules, while the academic test targets peak identification using fixed geometric thresholds. The practical takeaway is consistent across technical analysis guides: treat the shooting star as a contextual warning, require bearish confirmation, and test the exact identification and entry rules you plan to use on your own markets before relying on them (Bulkowski; Jamaloodeen, Heinz, and Pollacia).
When the shooting star fails — common failure modes
The pattern fails in several specific contexts:
- Runaway rallies with no nearby resistance. Price often ignores the wick, never confirms, and breaks above the high. Symptom: higher highs continue; no close below the shooting star’s low (TradingView).
- Range/chop. Long upper wicks are noise when recent bars alternate; a single wick lacks directional edge. Symptom: whipsaws and sideways price (ForexMT4Systems).
- Low volume or illiquid instruments. Wicks may reflect thin prints, not broad rejection; confirmation on a strong down candle is often absent. Symptom: light volume and meandering follow‑through (StockCharts ChartSchool).
- Misclassification. The same candle in a downtrend is an inverted hammer (bullish context), not a shooting star. Symptom: lower lows into the candle, not higher highs (ChartGuys).
- Two‑line “shooting star” near tops. Bulkowski’s two‑candle, gapped variant continues upward about 61% of the time on daily data; shorting it bets on the less frequent outcome (as of 2026; Bulkowski — two‑line).
Explicit invalidation is a move above the shooting star’s high or the absence of a confirming close below its low within subsequent bars (TradingView). In practice, either higher highs print immediately after the candle or price consolidates without producing the required bearish close. In both cases, the wick’s warning proves insufficient, so traders stand aside or exit per plan.
Look‑alikes — quick comparison
A quick decision rule helps avoid false labels. First, establish trend: after a rise the same candle can be a shooting star; after a decline it is an inverted hammer. Next, check the body: if open ≈ close (no real body), it is a gravestone doji; if there is a real body near the low with a long upper shadow and minimal lower shadow, it can qualify as a shooting star. Finally, confirm that the long shadow is on the top (shooting star family) rather than on the bottom (hammer/hanging man family).
| Pattern | How it differs | Where to read more |
|---|---|---|
| Inverted hammer | Same candle, but in a downtrend; classically bullish. Bulkowski reports bearish continuation 65% of the time on daily data (as of 2026; Bulkowski — Inverted Hammer). | Our hammer family explainer: Hammer candlestick (incl. hanging man) |
| Gravestone doji | Open ≈ close (no real body). A shooting star must not be a doji (Bulkowski). | Our doji guide: Doji candlestick (incl. dragonfly and gravestone doji) |
| Hammer / Hanging Man | Long lower‑shadow patterns (mirror family). Hammer after declines (bullish); Hanging Man after advances (bearish) (ChartGuys). | See: Hammer candlestick (incl. hanging man) |
Adjacent topic not owned here: evening star (multi‑candle reversal) — covered in a future page. Related: Bearish engulfing — full rules and stats: Bullish and Bearish Engulfing pattern.
Tracking the shooting star in TakeProfit
TakeProfit supports manual workflows for the shooting star candle. In short: you identify the formation of a shooting star by eye and plan risk‑reward on chart; the platform does not auto‑detect the pattern or execute orders.
- Identify and measure: Manually inspect the candle’s shape and use Measurement tools to verify upper‑shadow ≥ 2× body and minimal lower shadow. Ratios are not computed for you; you draw and measure.
- Mark levels: Add and label Horizontal Lines at the high (stop reference) and low (confirmation) using line tools.
- Plan the trade: Use the Long‑Short Tool to set entry near the confirmation level, stop above the high, and targets at support or Fibonacci areas; configure risk‑reward and partial exits as needed (TakeProfit Long‑Short Tool).
Limitations (concrete): no automatic pattern recognition; no order routing (the Long‑Short Tool is a planner only); levels and labels are placed manually. In short: you draw it; we don’t detect or trade it for you.
FAQ
-
Is a shooting star bullish or bearish?
The shooting star is a bearish warning after an advance; seek confirmation via a close below its low (Investopedia; StockCharts ChartSchool). -
Difference between a shooting star and an inverted hammer?
Same shape. In an uptrend it’s a shooting star (bearish warning); in a downtrend it’s an inverted hammer. Bulkowski reports 65% bearish continuation for the inverted hammer on daily data (as of 2026; Bulkowski — Inverted Hammer). -
What does a red shooting star mean?
Either color qualifies. A bearish (red/black) close modestly strengthens the warning because it finishes below the opening price (Investopedia). -
How do you identify a shooting star?
After an advance, look for a small body near the low, minimal lower shadow, and an upper shadow at least twice the body; then seek a close below the low to confirm (Bulkowski; TradingView). -
How reliable is a shooting star?
Bulkowski’s daily‑data tests found 59% bearish reversal for the single‑line pattern (as of 2026). One academic study found closing‑price definitions perform about like random, but using the high as the top improves peak detection (Jamaloodeen, Heinz, and Pollacia, 2018). -
What is the “3 candle rule”?
No standard rule. Major guides prefer confirmation via a close below the shooting star’s low or a strong down candle rather than a fixed number of bars (TradingView; StockCharts ChartSchool).
This explainer on candlestick patterns is for education only and is not investment advice. Learn how to use measurement tools in TakeProfit: TakeProfit docs: measurement tools