Last updated: September 2026
Disclosure: The section on tracking the pattern uses TakeProfit's charting tools as a worked example; other charting platforms offer comparable drawing tools and price alerts.
Quick answer: A doji candle is a single candlestick where the open and close prices are the same or nearly the same, signaling indecision in the market. Alone it’s neutral; context and a confirming close above the doji’s high (bullish) or below its low (bearish) drive interpretation. Common types of doji include long‑legged, dragonfly, gravestone, and four‑price.
Doji candlestick — at a glance
Doji chart pattern: a neutral one‑candle candlestick formation defined by open ≈ close; traders often require a close beyond the candle’s extremes for any signal.
| Attribute | Detail |
|---|---|
| Type | Neutral/indecision single candle; meaning comes from context (StockCharts ChartSchool: Introduction to Candlesticks). |
| Signal direction | None by itself; treat as neutral and wait for confirmation (ChartSchool overview). |
| Where it forms | Any trend; location such as support/resistance determines significance (ChartSchool on candlesticks and support). |
| Typical duration/timeframe | Any timeframe; a doji is one period on the chosen candlestick chart (Investopedia: Doji). |
| Confirmation | A common approach is to wait for a close above the doji’s high (bullish) or below its low (bearish); Bulkowski defines the breakout as the top or bottom of the candle (Northern Doji). |
| Entry trigger | Usually the same close‑beyond‑high/low confirmation on the following candle; intrabar breaches are often ignored (Northern Doji). |
| Stop placement | Frequently placed just beyond the opposite extreme of the doji in educator examples (Investopedia — dragonfly overview). |
| Target convention | “Measure rule” (project candle height from breakout). Examples from Bulkowski’s tests on U.S. stocks (hundreds of perfect trades): Northern doji best target‑hit 88% (bull market, up breakout); Gravestone doji 79% (bear market, up breakout) (Northern Doji; Gravestone Doji). |
| Performance note | Weak short‑term follow‑through is common; for example, the dragonfly’s 10‑day performance rank is 98/103 in Bulkowski’s tests (Dragonfly Doji). |
Doji — how to identify it: open ≈ close; shadows define subtype
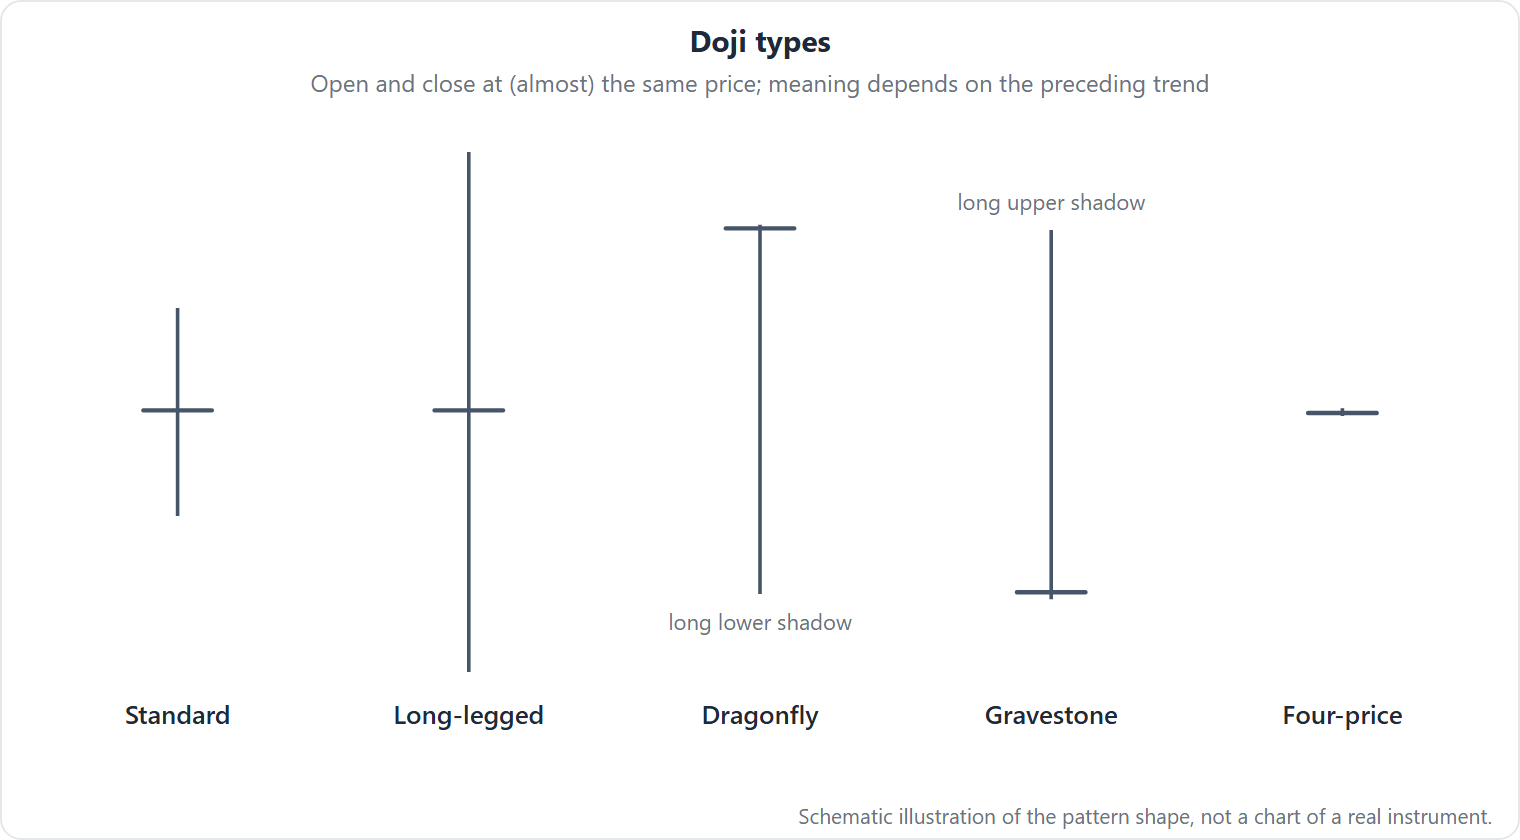
A doji candlestick is defined by the open and close being virtually equal, creating a very small real body. Shadow structure determines the type of doji (long‑legged, dragonfly, gravestone, or four‑price). StockCharts describes the body as appearing as a thin line relative to recent candles; Capital.com offers a quantitative rule of thumb.
Identification rules (with source attributions)
1) Open ≈ Close: the real body is extremely small; “open and close are virtually equal,” and the body should appear as a thin line (ChartSchool — introduction). A quantitative rule of thumb: Body < 10% of the high–low range (Capital.com: Doji candlestick pattern).
2) Shadows vary: a doji can have short or long shadows; shadow length defines the subtype (ChartSchool — introduction).
3) Long‑legged doji: both shadows are long versus recent candles; open/close within a few pennies of each other (Bulkowski: Long‑Legged Doji).
4) Dragonfly doji: long lower shadow; open/close near the high. Some stricter educators require Open = High = Close (Investopedia — dragonfly overview).
5) Gravestone doji: long upper shadow; open/close near the low; little or no lower shadow (Bulkowski: Gravestone Doji).
6) Four‑price doji: Open = High = Low = Close (rare), forming a single horizontal line (Wikipedia: Doji).
Note on prior trend and taxonomy: for single‑candle doji variants in Bulkowski’s tests, there is no prior‑trend requirement; context drives interpretation (Long‑Legged Doji). “Northern doji” is Bulkowski’s term for a doji in an uptrend; he uses it to categorize breakouts and performance (Northern Doji).
Practical tolerance and volume: Capital.com’s Body < 10% guideline gives an objective check, while Bulkowski’s “within a few pennies” phrasing reflects visual tolerance that scales with tick size (Long‑Legged Doji). Major sources do not publish a formal volume rule for single doji; some traders monitor elevated volume for added conviction, but no universal threshold is cited in the core references.
Doji — why it forms: a visual stalemate after intraperiod swings
A doji candle reflects a tug‑of‑war in which price probes higher and lower but closes near the open price, signaling indecision in the market (ChartSchool TA 101 — Part 16). Think of a tug‑of‑war where the flag whips back and forth but finishes the round near the center line: strong efforts both ways, little net progress.
Interpreting the shadow layout follows this logic. A dragonfly’s long lower wick shows that sellers pushed down but buyers bid it back to the open by the close (rejection of lows). A gravestone inverts that sequence, with buyers testing higher levels and sellers knocking price back (rejection of highs). A long‑legged doji shows both extremes tested intraperiod with neither side retaining control. A four‑price doji compresses to a single price for the entire bar, a visual of extreme short‑term equilibrium.
Context such as nearby support/resistance and the existing trend imparts meaning to these silhouettes; the same doji may signal exhaustion at resistance after a rally but say little mid‑range in congestion (ChartSchool on candlesticks and support).
Doji — how traders trade it: usually only with confirmation
Most trading strategies treat single doji candlesticks as neutral and act only after confirmation, combined with location (support/resistance) and trend context.
-
Entry (confirmation‑first): wait for the next candle to close above the doji’s high (bullish) or below its low (bearish). Bulkowski categorizes breakouts by a close beyond the candle’s top/bottom (Northern Doji).
-
Stops: a common convention is just beyond the opposite extreme of the doji (e.g., below the low for longs), shown in educator examples (Investopedia — dragonfly overview).
-
Targets: a simple “measure rule” projects the candle’s height (High − Low) from the breakout; Bulkowski reports target‑hit rates by variant (Northern/Gravestone pages linked above).
Nuances in confirmation and invalidation:
- Inside close = no signal: if the following bar closes back inside the doji’s range, there is no confirmed direction; many traders simply maintain the doji’s high/low as triggers and wait.
- Gaps: a gap that opens beyond the doji’s extreme is not, by itself, a breakout under Bulkowski’s close‑based convention; the close still needs to finish beyond the level (Northern Doji).
- Failed confirmation: after a valid breakout close, a prompt close back within the doji’s range often signals a trap and resets the setup; the original stop placement beyond the opposite extreme helps limit damage.
- Volatility fit: the Body < 10% guideline (Capital.com) can filter borderline spinning tops that otherwise generate frequent whipsaws.
Illustration: a worked example (hypothetical)
This example is hypothetical for illustration only.
-
A dragonfly‑like doji forms after a decline with High = 100.50, Low = 98.50, Open = 100.40, Close = 100.40. Body = 0.00; Range = 2.00; Body/Range = 0% (≤10% guideline; doji) (Capital.com — rule of thumb).
-
Long trigger: the next candle closes at 101.00, above the doji’s high, providing bullish confirmation.
-
Stop: 98.40, a little below the doji’s low (Investopedia — dragonfly overview).
-
Risk per share: 101.00 − 98.40 = 2.60.
-
Measured‑move target: candle height = 2.00; Target = 101.00 + 2.00 = 103.00.
-
Reward to target: 103.00 − 101.00 = 2.00. Reward‑to‑risk = 2.00 / 2.60 ≈ 0.77, which is unfavorable relative to a 1:1 or better profile. Traders who still choose to trade doji candlesticks in this situation may wait for a pullback entry to improve reward‑to‑risk, reduce size, or pass on the setup if higher‑timeframe context does not add conviction.
Position sizing example: with 1% account risk of $1,000 on a $100,000 account, dollar risk = $1,000; shares = $1,000 / $2.60 ≈ 384 shares (rounded down).
Doji — what the evidence says: near‑random alone, better in combinations
Methodology note: Bulkowski’s pages summarize tests on U.S. stocks drawn from his Encyclopedia of Candlestick Charts, with results “based on hundreds of perfect trades” and ranks out of 103 patterns. The exact web‑page sample period is not published.
-
Long‑legged doji: bullish continuation 51% (treated as random); overall performance rank 37 (Long‑Legged Doji).
-
Dragonfly doji: reversal 50% (random); overall rank 98; 10‑day performance rank 98 (Dragonfly Doji).
-
Gravestone doji: bearish reversal 51% in uptrends (near random); overall rank 77 (Gravestone Doji).
-
Northern doji (Bulkowski’s name for a doji in an uptrend): continuation 51%; frequency rank 6; overall rank 83; best 10‑day average move 3.17% (bull market, up breakout); measure‑rule target met 88% in tested subsets (Northern Doji).
-
Gapping down doji: acts as a bullish reversal 56% despite bearish‑continuation lore; overall rank 88; best 10‑day average move 2.52% (bull market, up breakout) (Gapping Down Doji).
Academic context aligns with weak standalone edges. Marshall, Young, and Rose (2006) conclude that candlestick strategies generally do not create value after costs for equities; the linked summary does not state the exact sample period (Journal of Banking & Finance — paper summary).
Doji — common failure modes and what they look like
Typical ways a doji candle pattern disappoints:
-
Range congestion whipsaws: clusters of doji inside ranges can break either way and reverse quickly; long‑legged doji often marks indecision with little sustained trend in tests.
-
No confirmation: a doji near a key level is followed by a candle that does not close beyond the doji’s high/low; price often rotates the other way, voiding the setup.
-
Short‑lived moves after breakout: even confirmed dragonfly/gravestone breakouts can stall; 10‑day follow‑through is weak in Bulkowski’s rankings.
What this looks like on a chart:
- Whipsaw cluster: several small bodies with alternating upper/lower shadows and overlapping highs/lows. A simple test is to keep the first doji’s high/low as a box. If the next few closes stay inside, stand aside until a decisive close outside the box (ChartSchool on candlesticks and support).
- Tease and fade: the next bar pierces the doji’s high/low intraperiod but closes back inside (no confirmation). Under a close‑based rule, that is a non‑signal and often precedes the opposite probe.
- Pop and drop: a valid breakout close is immediately followed by a close back within the doji’s range, signaling a trap. This is where the initial stop beyond the opposite extreme pays for itself.
Very short intraday charts amplify noise, producing many inconsequential doji; many educators stress higher‑timeframe context.
Doji — look‑alikes and quick tests
Visually similar candlesticks and how to tell them apart.
| Pattern | How it differs | Where to read more |
|---|---|---|
| Hammer | Small body near the top of the range with a long lower shadow; for a doji, confirm open ≈ close. | See our hammer guide: Hammer candlestick (incl. hanging man) |
| Shooting star | Small body near the low with a long upper shadow; for a gravestone‑like candle, check open ≈ close near the low. | See our shooting star guide: Shooting Star candlestick (incl. inverted hammer) |
| Spinning top | Small body with upper and lower shadows; a textbook doji’s body is extremely small (often a thin line). | StockCharts on doji vs spinning tops and support (one overview) |
If in doubt, compute Body/Range as a quick filter. A spinning top often has a larger body proportion, whereas a doji should come in under a rough 10% threshold (Capital.com). Also verify subtype placement: for a hammer the close can differ notably from the open, while a dragonfly/gravestone keeps them virtually equal near one extreme.
How to track a doji in TakeProfit
Limitation up front: current TakeProfit docs do not describe automatic doji recognition or candlestick‑pattern alerts; you must identify doji and manage level‑based tracking with drawing tools.
On TakeProfit charts, you can track a doji manually by marking its extremes for confirmation and planning any measured move.
-
Draw confirmation levels: mark the high and low of the doji with Horizontal Ray and note intended direction after a confirming close (TakeProfit line tools — docs).
-
Map context: sketch nearby support/resistance with Line or Ray. Use a parallel channel to frame ranges you plan to avoid until a close outside occurs.
-
Plan the measured move: measure the candle’s height (High − Low) and annotate a projected line from the eventual breakout price. This lets you see, at a glance, where a “measure rule” target would land relative to structure.
-
Track clusters: when several doji or spinning‑top candles form a tight box, extend the initial rays to bracket the congestion. Treat a close outside that bracket as the first condition to consider, then re‑apply the doji confirmation logic to the break candle.
Note: If you prefer to work directly in the Chart widget, use the same drawing tools and level‑based workflow described in the documentation.
Doji — FAQ
What happens after a doji?
Often nothing decisive. Many traders wait for a confirming close beyond the high/low. Bulkowski’s single‑doji tests show weak, short‑lived moves on average (see evidence section above).
Can a doji be a bullish candle or a bearish candle?
By color a doji may print as either, but doji alone is neutral. A bullish or bearish read arises only after a close beyond the doji’s high or low and with supportive context (ChartSchool introduction).
Is a doji a reversal pattern?
A single doji is not a reliable trend reversal by itself. Multi‑candle “doji star” patterns are separate formations with their own rules.
Which type of doji signals a potential reversal?
Traditionally the gravestone near tops and dragonfly near bottoms, but Bulkowski finds near‑random single‑candle behavior (about 50–51%) in U.S. stocks (see evidence section).
Does volume on the doji matter?
There is no standard volume threshold in the core references for single doji. Some traders prefer to see rising volume to validate a potential reversal, but major sources do not publish a universal rule.
Do doji work across asset classes (stocks vs forex vs crypto)?
The core definition applies everywhere. Most published performance statistics we cite come from U.S. equities (Bulkowski). Cross‑asset behavior can vary with market microstructure; use doji with confirmation and context, especially in 24‑hour markets like FX and crypto.
How do algorithmic tools detect doji patterns in trading platforms?
Detection rules vary. A common approach is a body‑to‑range filter such as Body < 10% of (High − Low), with subtype‑specific shadow checks (Capital.com). Thresholds differ by vendor, so pattern signals may not align across platforms.
What timeframe is best for a doji?
There’s no formal rule. Many educators emphasize daily/weekly charts for signal quality; intraday doji are noisier (Investopedia — Doji).
How do you confirm a doji signal?
By a close above the doji’s high (bullish) or below its low (bearish); intrabar breaches are more prone to whipsaw. Bulkowski defines the breakout at the candle’s top/bottom (Northern Doji).
This article is for education only and is not investment advice. Learn the line tools you can use to mark highs, lows, breakouts, and targets: TakeProfit docs — line tools
To get notified when price closes beyond the level you drew, see TakeProfit's alert trigger criteria.