Last updated: September 2026
Disclosure: The section on tracking the pattern uses TakeProfit’s charting tools as a worked example; other charting platforms offer comparable drawing tools and price alerts.
Quick answer: The engulfing candlestick pattern is a two‑candle trend reversal setup where the second real body fully covers the first. A bullish engulfing pattern follows a decline; a bearish version follows a rise. Many treat it as short‑term and wait 1–3 days for a close beyond the pattern’s high/low for confirmation (StockCharts’ bullish/bearish reversal primers; ThePatternSite — Bearish Engulfing).
At a glance
| Attribute | Detail |
|---|---|
| Type | Reversal pattern; typically short‑term and context‑dependent (StockCharts — bullish reversals). |
| Signal direction | Bullish after a decline; bearish after a rise. |
| Where it forms (trend context) | Bullish engulfing within a local downswing; bearish within a local upswing. Bulkowski advises aligning with the primary trend (for example, a bullish engulfing after a pullback in an uptrend) (ThePatternSite — Bullish Engulfing). |
| Typical duration/timeframe | Effects are usually short‑term (often 1–2 weeks). Look for confirmation within 1–3 sessions (StockCharts’ reversal primers). |
| Confirmation | Follow‑through in 1–3 sessions via a gap, long candle, or high‑volume move in the signal direction (StockCharts — bearish reversals). |
| Entry trigger | Bearish: first close below the pattern’s low (Bulkowski’s breakout rule; ThePatternSite — Bearish Engulfing). Bullish: many wait for a confirming close higher within 1–3 days. |
| Stop placement | Common convention: place the stop just beyond the pattern’s extreme (e.g., above the engulfing high for shorts) and treat it as invalidation. |
| Target method | No intrinsic price‑target formula; traders use support/resistance or risk/reward multiples. Investopedia notes engulfing “does not provide a price target” (Investopedia). |
| Common pitfalls | Bearish engulfing moves can fade quickly; bullish engulfing shows mediocre overall net performance in Bulkowski’s tests (ThePatternSite — Bullish Engulfing; ThePatternSite — Bearish Engulfing). |
Best for (summary)
- Day traders: appears often; use 1–3 day confirmation and clear invalidation to avoid noise.
- Swing traders: works best after pullbacks within the primary trend and near support/resistance.
- Position traders/investors: limited utility; signals are short‑term and typically do not project long trends.
How to identify the engulfing candlestick pattern (checklist)
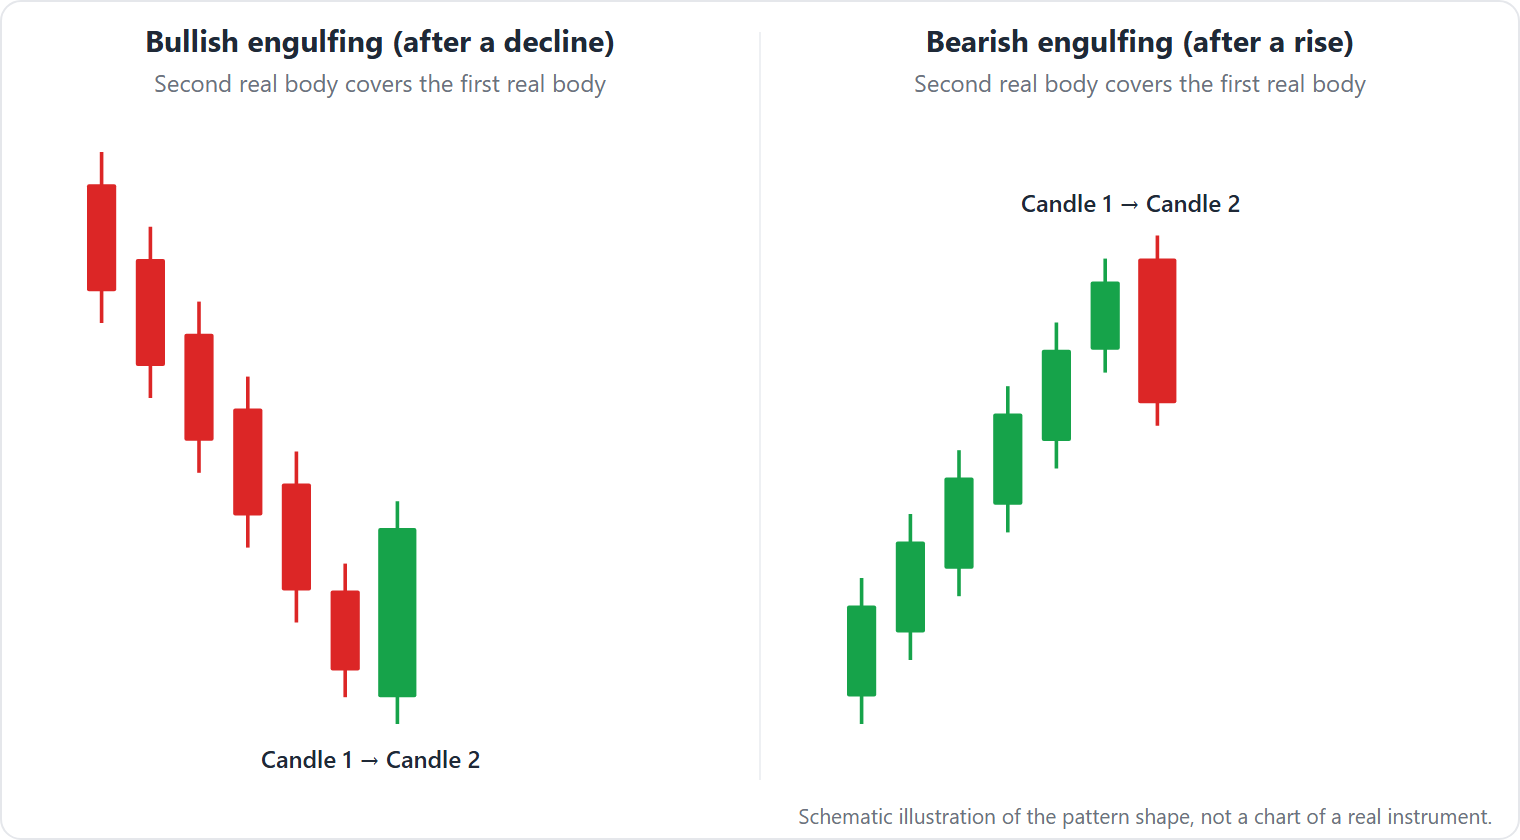
The engulfing setup is a two‑candle formation where the second real body completely covers the first body. The pattern appears after a short‑term swing in the opposite direction and is classified as a reversal. Traders describe it as bullish or bearish depending on context (bullish or bearish engulfing candlestick).
1) Two candles only. Both bullish and bearish engulfing are two candle lines.
2) Prior context. Bullish engulfing after a down swing; bearish engulfing after an up swing (StockCharts’ reversal primers).
3) Colors. Bullish: a down day (red/black candlestick) then a larger up day (green/white bullish candle). Bearish: an up day followed by a larger down day (bearish candle).
4) Body‑overlap rule. The second body should engulf the first body. Bulkowski ignores shadows; some sources present a stricter variant implying full high–low engulfment for bullish patterns (BabyPips — Engulfing).
5) Open/close relationships (bearish). Textbook bearish engulfing opens above the prior close and closes below the prior open, ensuring body engulfment (ThePatternSite — Bearish Engulfing).
6) Optional midpoint filter (bearish). Some treat a close below the midpoint of the first body as a stronger bearish signal (StockCharts — bearish reversals).
7) Size emphasis. Prefer a long second candle; avoid a doji as the first candle so the engulfment is non‑trivial.
8) Confirmation. Seek 1–3 sessions of follow‑through, sometimes with volume expansion.
Clarification on wording: many definitions say “the second candle engulfs the first candle’s body.” In strict variants, the second candle’s range must also exceed the first bar’s shadows; in Bulkowski’s definition, only the real bodies matter.
Why this pattern forms (interpretation)
Engulfing patterns visualize a session where the opposing side takes control, producing a larger real body that engulfs the prior body. A bullish engulfing pattern depicts bears losing control to buyers; a bearish engulfing shows buyers losing control to sellers (BabyPips — Engulfing). These supply–demand narratives of who is “in control” are interpretations, not proofs. Formal research treats patterns as hypotheses to be tested statistically (for context, see Lo, Mamaysky & Wang (2000)).
Trading the engulfing pattern (entries, stops, targets)
The pattern is often traded on confirmation; many wait for price to prove direction before entering.
Entries
– Conservative confirmation: wait for a close above the engulfing high (bullish) or below the engulfing low (bearish) within 1–3 sessions.
– Mechanical bearish breakout: Bulkowski defines a downward breakout for the bearish engulfing pattern as the first close below the pattern’s low (ThePatternSite — Bearish Engulfing).
Stops
– Common convention: set the stop just beyond the pattern’s extreme (e.g., above the engulfing high for shorts, below the engulfing low for longs). This stop placement is a widely used invalidation point rather than a canonical rule.
Targets
– There is no measured‑move formula. Use nearby support/resistance or risk/reward multiples. The bullish engulfing pattern does not provide a native price target (see table for reference).
Illustration (bearish):
Suppose a bearish engulfing pattern occurs on XYZ after an upswing.
– Day 1 (white): candle opens 99, closes 101.
– Day 2 (black): candle opens 102, closes 98. Assume the high of Day 2 is 102.10 and the low is 97.90; the second body engulfs the first.
– Entry trigger: on Day 3 (the session after the pattern completes), enter only if the close is below 97.90; assume you enter at 97.80.
– Stop: just above the pattern high, for example 102.20 (above the 102.10 high). Risk per share = 102.20 − 97.80 = 4.40.
– 2:1 risk/reward target: 97.80 − (2 × 4.40) = 89.00. If price reaches 89.00, reward = 8.80; risk/reward = 2.0.
What the evidence says
Results depend on definitions and context.
- Bullish engulfing pattern. Bulkowski reports a bullish reversal rate of 63% (rank 22/103). He also lists frequency rank 12 and overall performance rank 84. These numbers are “based on hundreds of perfect trades,” and “reversal rate” means price closes above the top of the pattern (ThePatternSite — Bullish Engulfing). The sample period is not published on his page.
- Bearish engulfing pattern. Bulkowski reports a bearish reversal rate of 79% (rank 5/103), frequency rank 11, and overall performance rank 91; he adds “based on 20,000 trades studied,” and defines the downward breakout as the first close below the bottom of the two‑candle pattern (ThePatternSite — Bearish Engulfing). The sample period is not published on his page.
Note on sample size wording: Bulkowski’s bullish page cites “hundreds of perfect trades,” while the bearish page cites “20,000 trades studied.” He does not publish the selection details or date ranges on those pages, so the reason for the difference is not stated.
StockCharts frames engulfing as a short‑term reversal requiring confirmation within 1–3 days and notes stronger bearishness when the black candlestick closes below the prior body’s midpoint (StockCharts — bearish reversals). A dedicated RePEc‑indexed paper finds short‑term forecasting power for definitions using open–high/low criteria, but not close‑only criteria (RePEc study). Practitioner tests diverge: AnalyzingAlpha’s cross‑market work reports a negative edge for naive shorts and suggests that, especially in crypto, the setup often signals volatility/mean‑reversion rather than a lasting trend reversal (AnalyzingAlpha).
When it fails (conditions and what you see)
- Choppy/range conditions: Without a clear prior swing, you’ll see overlapping candles and no series of higher highs/lows; confirmation often fails within 1–3 sessions.
- Against the primary trend: Bullish engulfing in a primary downtrend often pops for a few bars and then makes new lows; Bulkowski advises trading with the primary trend.
- Trivial engulfment: A tiny first‑day doji makes body overlap easy; follow‑through is frequently absent in the next 1–3 sessions.
- Exogenous news/gaps: Earnings or macro surprises can overwhelm prior candles; patterns are not shields against new information (methodology background: Lo, Mamaysky & Wang (2000)).
- Highly volatile assets (e.g., some crypto): naive shorts after a bearish engulfing candlestick can underperform; tests suggest the pattern may signal volatility and mean reversion rather than clean direction (AnalyzingAlpha).
Look‑alikes: how to tell them apart
| Pattern | How it differs | Where to read more |
|---|---|---|
| Outside bar (outside reversal day) | Requires the second bar’s full high–low range to exceed the prior bar’s range; engulfing typically requires only body overlap. | StockCharts ChartSchool (glossary/index). |
| Harami (bullish/bearish) | Inverse relationship: the second, smaller body lies within the first large body (the opposite of an engulf candle). | StockCharts’ bullish/bearish reversal sections. |
| Hammer vs bullish engulfing | Hammer is a single candle with a small body and long lower shadow; no body‑overlap requirement. | Hammer candlestick (incl. hanging man) |
| Shooting star vs bearish engulfing | Shooting star is a single candle with a long upper wick; bearish engulfing is a two‑candle body‑overlap reversal. | Shooting Star candlestick (incl. inverted hammer) |
Tracking engulfing in TakeProfit (steps and one limitation)
TakeProfit can be used to mark confirmation and invalidation levels and to plan risk/reward directly on the chart.
- Mark levels: Use a Horizontal Ray or Horizontal Line to flag the engulfing high/low as confirmation and invalidation levels (see TakeProfit Line tools docs).
- Assess context: Use Trend Angle to gauge the steepness of the prior swing and Parallel Channel to frame the recent move.
- Plan trades: Label the intended entry (confirmation close), stop (beyond the pattern extreme), and target (e.g., 1:1 or 2:1) on horizontal levels. You can save labels in Templates for reuse.
Limitation: The public docs we cite do not list automatic candlestick pattern recognition or native engulfing alerts; in this workflow you identify patterns and monitor your levels manually. See TakeProfit Line tools for the drawing tools mentioned above.
FAQ
What is bullish engulfing and bearish engulfing?
These are two‑candle reversal patterns. A bullish engulfing candle follows a decline (a down candle engulfed by a larger up candle). A bearish engulfing candlestick follows a rise (an up candle engulfed by a larger down candle). The second body should completely cover the first body.
Is the bearish engulfing candlestick pattern good for day trading?
Results are mixed and context‑dependent. Many traders wait for confirmation and combine it with levels, trend, and volume. Some tests find short‑term effects that fade quickly, and one cross‑market backtest reports a negative edge for naive shorts.
How do you identify engulfing patterns?
Find two opposite‑colored candles where the second body completely covers the first body. A bullish engulfing pattern occurs after a down swing; a bearish engulfing pattern occurs after an up swing. Some definitions ignore shadows; stricter variants want the second bar to exceed the first bar’s range (BabyPips — Engulfing).
What is the 3 candle rule?
It is not part of engulfing. Canonical engulfing uses two candles, often traded with 1–3 days of confirmation.
Is there a “most successful” candlestick pattern?
There isn’t a universal winner. Performance varies with definition, market, and context. Bulkowski ranks bearish engulfing 5th for reversal rate and bullish engulfing 22nd out of 103 candlestick patterns, and he notes that post‑breakout trends can be short‑lived (ThePatternSite — Bearish Engulfing; ThePatternSite — Bullish Engulfing).
This guide is educational and not investment advice. For platform details, read the TakeProfit docs: Pattern tools