Last updated: October 2026
Disclosure: The section on tracking the pattern uses TakeProfit‘s charting tools as a worked example; other charting platforms offer comparable drawing tools and price alerts.
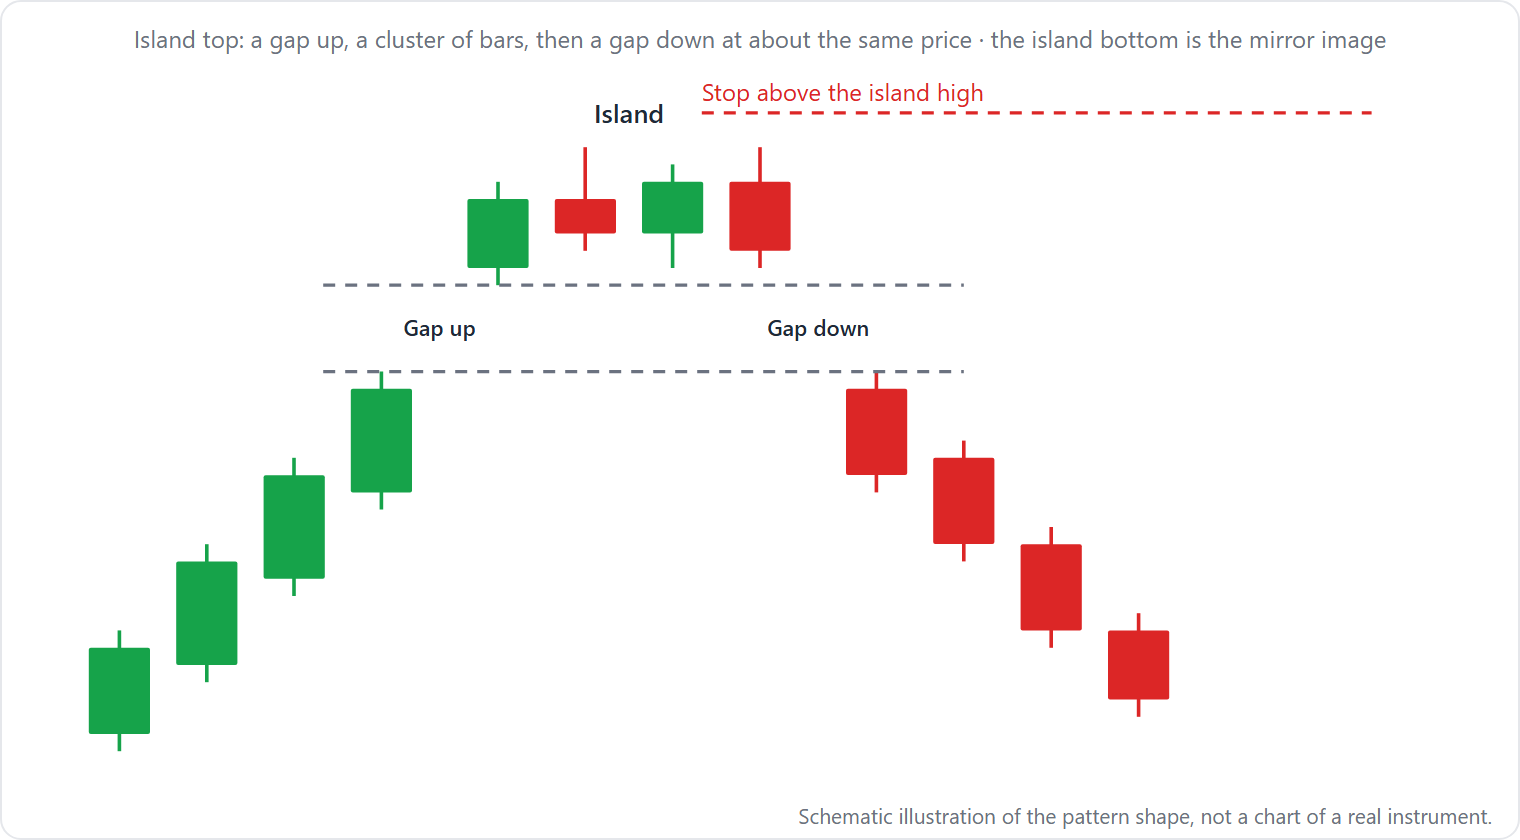
Quick answer: An island reversal is a reversal chart pattern formed by two price gaps that share a common price range, isolating a cluster of trading activity (the “island”) after a prior trend. The second gap on above-average volume confirms the pattern, and the breakout direction follows that second gap.
Figure 1: Island reversal pattern on a daily chart: the first gap isolates the island from the prior trend, and the second gap on above-average volume confirms the reversal.
At a Glance
| Attribute | Detail |
|---|---|
| Type | Reversal pattern (bullish island bottom; bearish island top) |
| Trend requirement | Prior sustained uptrend (for tops) or downtrend (for bottoms) — (Bulkowski, thepatternsite.com, August 2020) |
| Typical duration | One day to several months — |
| Key identification | Two price gaps that share some or all of the same price — |
| Volume confirmation | High on the day of the second gap — |
| Entry trigger | Breakout beyond the second gap’s extreme after confirmation (common convention; no single rule in primary sources) |
| Stop placement | Beyond the opposite side of the island’s extreme (common convention) |
| Target method | Measure rule: island height (highest peak minus lowest valley) × percentage meeting target — |
| Most common failure | Throwback/pullback that fills the gap — |
Island Reversal Pattern: How to Identify It
Use this numbered checklist, based on the criteria from Thomas Bulkowski (thepatternsite.com, August 2020) and other sources, to confirm a true island reversal.
1. Prior trend. The price must be trending upward to form an island top and trending downward to form an island bottom. The pattern cannot appear in a range-bound market.
2. Two gaps that separate the island from the mainland. The island is a cluster of candles (or a single candle) that is isolated by a gap on each side: a first gap in the direction of the prior trend, then, after some time, a second gap in the opposite direction.
3. Gap alignment. The two gaps must share some or all of the same price. This is the defining characteristic that separates island reversals from long islands (Bulkowski, thepatternsite.com, December 2018). Some secondary sources insist the gaps share “the exact same price,” but Bulkowski’s own wording allows “some or all” overlap.
4. Volume on the second gap. The day the second gap occurs should show above-average volume. Bulkowski specifically says: “High on the day price makes the second gap”.
5. Duration. The island can be as short as a single session or last several months. No minimum or maximum time is specified.
6. Breakout day. For island reversals, the second gap itself usually defines the breakout. For long islands, Bulkowski considers the day after the second gap as the breakout day (thepatternsite.com, December 2018).
Source disagreement on gap overlap. Bulkowski writes that the gaps “share some or all of the same price.” Some secondary sources (e.g., ChartGuys) add a stricter requirement that the gaps must overlap “exactly.” The difference matters: a narrower overlap requirement reduces the number of valid patterns and may affect statistical performance, but no comparative study has been published.
Why the Island Reversal Pattern Forms – Crowd Behavior
The island reversal pattern forms because of a psychological shift in the order book, with the gaps acting as price vacuums. The first gap reflects a surge of momentum in the direction of the prior trend — a breakaway gap. This gap pulls in traders who believe the trend will accelerate. The island represents a period of indecision: price moves sideways, often with slightly rising or falling swings, as institutional participants distribute shares (at a top) or accumulate (at a bottom) while retail traders who entered during the first gap find themselves trapped on the wrong side.
The second gap, often on heavy volume, shows that the momentum has shifted decisively. The “gap that leaves the island” is an exhaustion gap for the old trend and a breakaway gap for the new one. Anyone who bought during the island (on a top) is now holding a losing position, and their eventual panicked selling adds fuel to the reversal.
The island’s visual isolation on the chart reflects a psychological shift in the order book: the gaps act as price vacuums where no transactions occurred, and the price action inside the island becomes a compressed story of failed continuation.
How Traders Trade the Island Reversal Pattern
Traders can trade the island reversal pattern by entering after the second gap confirms the reversal. The following illustration uses hypothetical prices.
Illustration: Worked example for a bearish island reversal.
- Prior uptrend: stock rises from $42 to $50.
- First gap up: from $50 to $52.
- Island: price trades in a range, reaching a high of $55 and a low of $51 over five days.
- Second gap down: stock gaps from $53 to $48 on above-average volume.
Step 1 – Identify the island height. Island high = $55, island low = $51. Height = $55 − $51 = $4.
Step 2 – Entry. The pattern is confirmed when price closes below the second gap’s low ($48). A common entry is to sell short at the open of the next session or on a small pullback to the gap edge. Bulkowski suggests waiting for throwbacks and pullbacks to complete before taking a position (thepatternsite.com, August 2020).
Step 3 – Stop-loss placement. Place a buy-stop above the island’s high: $55. The risk per share is $55 − entry price (assume $48) = $7.
Step 4 – Target using the measure rule. Subtract the island height from the island low: $51 − $4 = $47. This is the target if the pattern meets the 100% target level. (Bulkowski multiplies the height by a percentage from his table, but that percentage is not published on his free page; the full height is a conventional starting point.)
Step 5 – Risk/reward check. Entry $48, stop $55 (risk $7), target $47 (reward $1 if using full height). This 0.14:1 ratio is poor; traders often wait for a better entry after a throwback, or skip patterns where the island height is small relative to the stop distance.
For a bullish island bottom, reverse the logic: first gap down, island, second gap up. Entry above the second gap’s high, stop below the island low, target = island low + island height (or a lower percentage).
Evidence on the Island Reversal Pattern
Bulkowski’s island reversal page (thepatternsite.com, August 2020) states its numbers are based on “2,000+ perfect trades,” meaning trades that followed all his identification rules and were executed at the best possible prices. However, that page does not publish a specific success rate or average rise for island reversals. It does say: “You can see why islands do not work well” and “Island bottom and top statistics updated on 8/26/2020.”
For long islands (a variant covered in this article), Bulkowski (thepatternsite.com, December 2018) writes, “As of 9/11/2020, I don’t consider long islands a valid chart pattern.” The same page reports “over a thousand of perfect trades” but again no single success percentage is given.
Honest summary: No credible peer-reviewed study of island reversals exists. The only large-sample research is Bulkowski’s, and his own free page does not release a standalone success rate. Readers should test the pattern themselves on historical data before trading it.
When the Island Reversal Pattern Fails
Three specific failure modes, each with a triggering condition and what the trader sees on the chart.
Failure mode 1 – Throwback/pullback fills the gap. After the second gap confirms the reversal, price retraces and closes back into the island or into the gap range. For a bearish reversal, this means a bounce that crosses back above the second gap’s low. The trader sees a failed breakdown. Bulkowski notes that “throwbacks and pullbacks hurt post breakout performance” (thepatternsite.com, August 2020). This happens most often after gaps on moderate volume or in range-bound markets where the prior trend was not strong.
Failure mode 2 – Premature entry before the second gap. A trader enters after the first gap, expecting a reversal, but the island continues in the original trend. The second gap never forms, or if it does, it gaps in the same direction as the first (creating a runaway gap). The chart shows a single isolated gap with no opposing gap. The pattern is not confirmed until the second gap appears, so entering early is a common mistake.
Failure mode 3 – Continuation after the second gap. The second gap prints, but after a few bars the original trend resumes and price moves back through the island. The trader sees a brief “island” that is quickly engulfed. This happens when the second gap is an exhaustion gap that fails because institutional volume was insufficient to reverse momentum. On the chart, price closes back inside the island within three to five sessions.
Island Reversal Pattern Look-Alikes
| Pattern | How It Differs | Where to Read More |
|---|---|---|
| Long island | Gaps do not share the same price; gaps may be separated by months; long islands are continuation patterns, not reversals (Bulkowski, thepatternsite.com, December 2018). | Covered in this page (look-alike table) |
| Head and shoulders | Uses a neckline and three peaks (or troughs); no gaps required. The reversal signal is the neckline break, not a second gap. | Head and Shoulders Pattern |
| Breakaway gap / Exhaustion gap | A single gap, not two with an island between them. A breakaway gap starts a new trend; an exhaustion gap ends one. Alone, neither forms an island reversal. | (Future page on gap types) |
Long island variant (owned by this page). Bulkowski’s long island page (December 2018) defines it as a pattern where the two gaps do not align in price. He calls it a “continuation pattern that performs best in bear markets” but adds a strong caveat: “As of 9/11/2020, I don’t consider long islands a valid chart pattern.” The measure rule for long islands uses half the island height rather than the full height. This page treats long islands as a distinct structural variant, not a true reversal.
Tracking the Island Reversal Pattern on a Chart in TakeProfit
TakeProfit does not currently offer automatic pattern recognition for island reversals. All steps are manual.
Step 1 – Draw the island’s boundaries. Use the Horizontal Ray tool (Alt+Shift+H) to draw a horizontal line at the highest high of the island and another at the lowest low. These lines mark the extremes used for the measure rule and stop placement.
Step 2 – Identify the gaps. Trace the first gap and the second gap by noting the price range where no trading occurred between consecutive sessions. Mark the gap edges with horizontal rays.
Step 3 – Set the breakout alert. Once the second gap is identified, set a price alert at the extreme of that gap. For a bearish island reversal, set an alert at the second gap’s low (the level that confirms a breakdown). For a bullish reversal, set an alert at the second gap’s high. TakeProfit allows alerting on price reaching a level; the specific trigger criteria (e.g., close beyond vs. touch) depend on the alert type chosen.
Step 4 – Visualize the trade with the Long/Short Tool (Alt+L). This tool lets you plot an entry price, a stop-loss level, and one or more target levels. Use it to calculate the risk/reward ratio before entering. For the worked example above, enter the short at $48, stop at $55, target at $47.
Limitation: The pattern must be drawn and recognized manually. TakeProfit’s gaps are visible on the chart, but the software does not automatically detect that two gaps share a common price range or that an island exists. Alerting is level-based, not pattern-based.
For further details on setting up alerts, see the alert trigger criteria in the TakeProfit documentation.
Island Reversal Pattern FAQ
Is an island reversal pattern bullish or bearish? Both. A bullish island reversal forms at the end of a downtrend (island bottom), while a bearish version forms after an uptrend (island top).
What does an island reversal pattern show? It shows a potential exhaustion of the prior trend and a reversal. The island’s isolation between two gaps suggests a sudden shift in market sentiment.
How reliable are island reversal patterns? Bulkowski’s work (thepatternsite.com, August 2020) suggests mixed performance; secondary claims of a 72% upward break frequency (ChartGuys, undated) are unverified. No peer-reviewed study confirms any number.
What is the difference between an island reversal and an abandoned baby? An abandoned baby is a three-candle candlestick pattern with a doji at the center, while an island reversal can contain many candles and uses gaps rather than candle bodies. The abandoned baby is a subset of the island reversal when the island is a single session.
What timeframes work best for island reversals? Daily charts are classic because overnight gaps create the isolation. Weekly charts can also work, but intraday gaps are uncommon and the pattern is rarely valid on minute timeframes.
How do I distinguish an island reversal from a long island? Check gap alignment. If the two gaps share any portion of the same price range, it is an island reversal. If they do not align, it is a long island (Bulkowski, thepatternsite.com, December 2018).
Related patterns: Double top and double bottom, Dead cat bounce.
This content is for educational purposes only and does not constitute investment advice; past performance is not indicative of future results.
Learn how to set up alerts for gap breakouts in TakeProfit’s documentation: TakeProfit Alert Trigger Criteria