Last updated: October 2026
Disclosure: The section on tracking the pattern uses TakeProfit‘s charting tools as a worked example; other charting platforms offer comparable drawing tools and price alerts.
Quick answer: The Gartley pattern is a five-point harmonic reversal structure (X-A-B-C-D) using specific Fibonacci ratios. It signals a potential trend reversal near point D in a downtrend (bullish Gartley) or uptrend (bearish Gartley). Entry is at D after price confirms a turn.
At a glance
| Attribute | Fact |
|---|---|
| Type | Reversal (harmonic) |
| Signal direction | Bullish (reversal up) or Bearish (reversal down) |
| Where it forms | End of a trend: uptrend → bearish Gartley; downtrend → bullish Gartley |
| Typical timeframe | Any, but rarer on short timeframes due to ratio strictness |
| Confirmation | Price turns above/below D after CD leg projection completes |
| Entry trigger | Buy / sell at D after turn confirmation |
| Stop placement | Close beyond point X (Bulkowski, thepatternsite.com, August 2020) |
| Target method | Measure rule: price often reaches B (~98–99%), less often A or C |
| Most common failure | Price breaks X before D completes |
How to identify a Gartley pattern on a chart
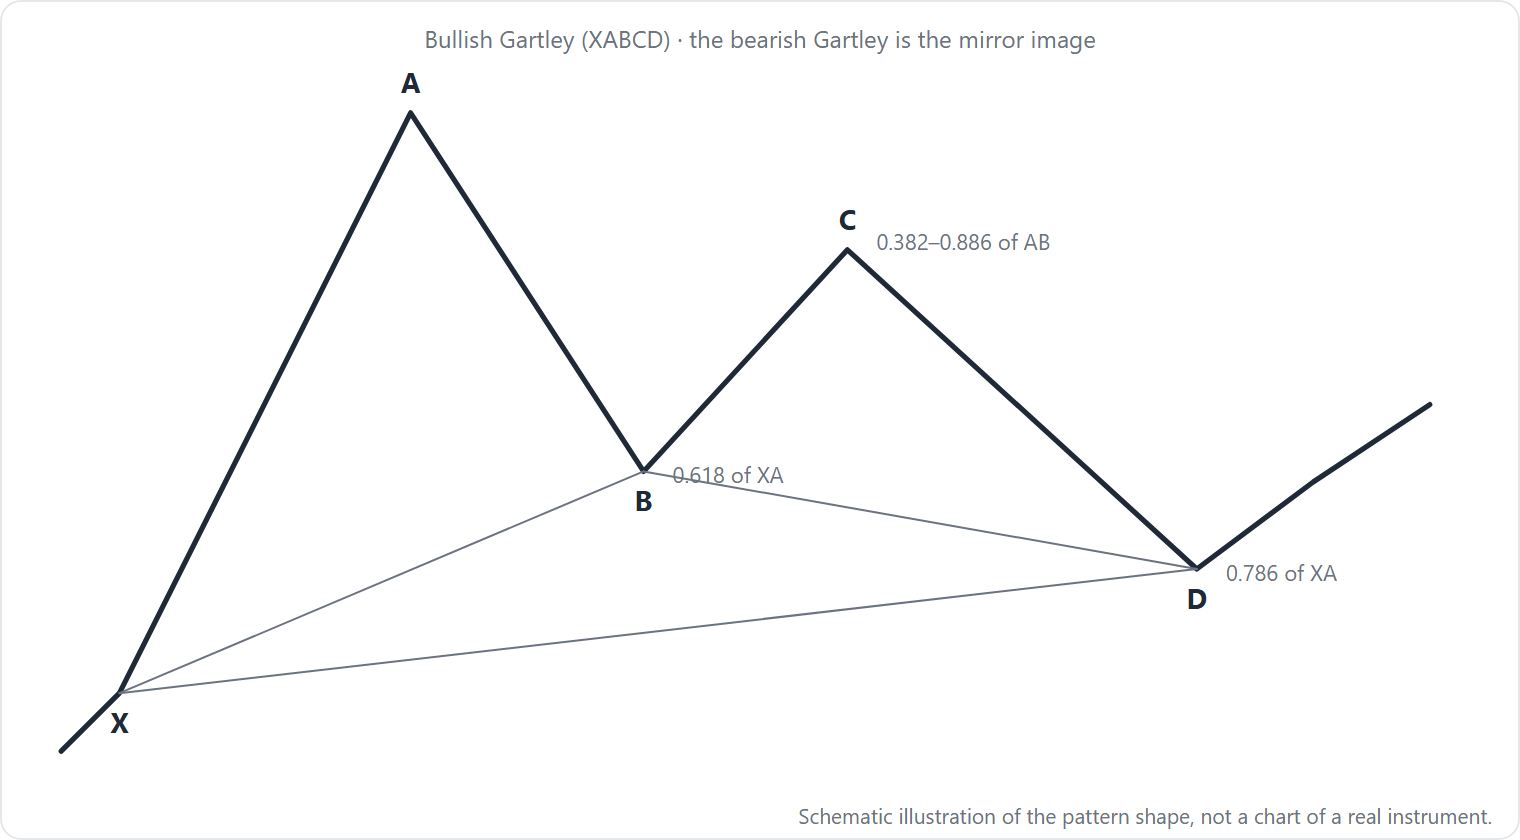
The Gartley pattern requires five swing points labeled X, A, B, C, D in sequence. Follow these numbered guidelines from Thomas Bulkowski (thepatternsite.com, August 2020):
-
X to A – A large impulse move. For a bullish Gartley, price drops from X to A. This is typically a sizable move to accommodate the retracements that follow.
-
A to B – Price retraces roughly 61.8% of the XA move. Bulkowski uses this value without specifying a hard tolerance; he calls it “about 61.8%.” Some harmonic traders allow a range near this level.
-
B to C – Price retraces 61.8% or 78.6% of the AB move. Bulkowski interprets this as a range of acceptable values. (Other sources, such as HarmonicTrader (1998/2016), require stricter adherence to a specific Fibonacci level.)
-
C to D – The CD leg extends 127% or 161.8% of the BC move. Again, Bulkowski treats this as a range.
-
Critical constraint – D must NOT go beyond X. For a bullish Gartley, price must not fall below X; for a bearish one, it must not rise above X. If price breaks X on the way to D, the pattern is invalid (Bulkowski).
-
D retracement of XA – Many harmonic traders require D to retrace 78.6% of XA (HarmonicTrader, 1998/2016). Bulkowski does not include this requirement; he uses only the BC projection. This is a known disagreement in the literature.
Rarity: Because so many ratio constraints must align, the pattern is “somewhat rare” (Bulkowski, thepatternsite.com, August 2020).
Why the Gartley pattern forms – crowd behavior interpretation
The Gartley pattern captures a multi-leg correction within a trending market. The retracements at AB and BC represent traders taking profits or entering counter-trend positions at Fibonacci levels—levels where limit orders and stops cluster. The final leg CD extends beyond the BC retracement into a “potential reversal zone” (PRZ) where buying or selling pressure may overwhelm the corrective move. However, the original 1935 diagram by H.M. Gartley showed a trend-continuation pullback, not a reversal (Bulkowski, thepatternsite.com, August 2020). The Fibonacci-based reversal rules are a later refinement by Scott Carney and other harmonic traders. The pattern thus reflects a debated market structure, not a proven universal mechanism.
How traders trade the Gartley pattern – entry, stop, target, with worked example
Entry conventions (Bulkowski and harmonic-trader sources)
- Entry at D: Enter long (bullish Gartley) or short (bearish Gartley) after price shows a turn at D. Confirmation can come from a candlestick pattern or a momentum shift.
- Stop loss: Place a stop beyond point X. For a bullish Gartley, a close below X triggers an exit. For a bearish Gartley, a close above X. A closer stop just beyond D is also possible if D is already established (Bulkowski, thepatternsite.com, August 2020).
- Targets: Use the measure-rule statistics. After price turns at D, it reaches B 98% of the time (bullish) or 99% of the time (bearish), C 59% (bullish) or 51% (bearish), and A 45% (bullish) or 34% (bearish). Many traders set a partial take-profit at B and let the rest run toward C or A.
Worked example – bullish Gartley (hypothetical round prices)
Illustration: A bullish Gartley forms in a downtrend. Identify swings:
- X = $100.00, A = $120.00 (up move of $20.00)
- AB retraces 61.8% of XA: 61.8% × $20.00 = $12.36. B = A – $12.36 = $107.64
- BC retraces 78.6% of AB: AB = $12.36. 78.6% × $12.36 ≈ $9.72. C = B + $9.72 = $117.36
- CD extends 127% of BC: BC = $9.72. 127% × $9.72 ≈ $12.34. D = C – $12.34 = $105.02. (Using 161.8% gives D = $117.36 – ($9.72 × 1.618 ≈ $15.73) = $101.63. The closer D is to X=$100 without breaking it, the more valid.)
Assume price reaches D at $102.00 without breaking X=$100. Enter long at $102.00.
- Stop: close below $100.00 (risk $2.00 per share).
- Target B at $107.64: profit $5.64 (risk/reward ~1:2.8).
- Target C at $117.36: profit $15.36.
Important: all prices are hypothetical, not a backtest or real trade.
Gartley pattern evidence – sourced statistics
Thomas Bulkowski analyzed over 1,900 perfect bullish Gartley patterns and over 2,400 perfect bearish Gartley patterns from his personal database (thepatternsite.com, updated August 2020). His “perfect trades” are patterns that met his ratio definitions exactly. Results:
- Bullish Gartley (1,900+ trades): After price turns at D, it rises to A 45% of the time, to B 98%, and to C 59%.
- Bearish Gartley (2,400+ trades): After turning at D, price falls to A 34% of the time, to B 99%, and to C 51%.
Limitations: These statistics come from one researcher’s proprietary database, not from a peer-reviewed academic study. No independent validation exists. Traders should test on their own markets and timeframes.
When the Gartley pattern fails – failure modes
-
Price breaks X before D completes: If on the way to D, price trades beyond X, the pattern is invalid (Bulkowski, thepatternsite.com, August 2020). This occurs in strong trends where momentum ignores harmonic levels. On the chart, you see price slip past X without reversal.
-
CD overshoots without reversal: D is projected using BC’s extension (127% or 161.8%), but price may continue far beyond, turning the potential Gartley into a Bat or Butterfly pattern—or a failed reversal. On the chart, price drives through the PRZ with no slowdown.
-
Congestion at the BC region: Bulkowski notes that most patterns stop in the BC correction zone (the area around B or C). Price may stall there rather than making a sustained move, resulting in a small gain that hits the stop. On the chart, after reaching D, price barely retraces to B.
-
False reversal at D: Price turns at D briefly but fails to follow through, leading to a stop hit at X. This often happens on low volume or after a news event disrupts the pattern.
Look-alikes – comparison table
The Gartley pattern is part of a family of harmonic patterns. The table below highlights key differences (sources: Bulkowski, thepatternsite.com, August 2020; HarmonicTrader, 1998/2016).
| Criteria | Gartley | ABCD Pattern | Bat Pattern | Butterfly Pattern |
|---|---|---|---|---|
| Points | X, A, B, C, D (5) | A, B, C, D (4) | X, A, B, C, D (5) | X, A, B, C, D (5) |
| B retracement of XA | 61.8% | N/A | 38.2%–50% | 78.6% |
| D retracement of XA | 78.6% (harmonic convention) | N/A | 88.6% | 127%–161.8% extension |
| D position vs X | Must not exceed X | N/A | Must not exceed X | Exceeds X |
| Typical shape | W (bullish) or M (bearish) | ABCD only | Similar but deeper | Extreme extension |
For the related ABCD, Bat, Butterfly, and Crab patterns, refer to the dedicated encyclopedia entries on those patterns (future publications).
Tracking the Gartley pattern in TakeProfit
TakeProfit provides manual tools to draw and analyze the Gartley pattern. Follow these steps:
-
Place the XABCD Pattern Tool (under Pattern Tools) on a clear chart. Manually set the five control points (X, A, B, C, D) on visible swing highs and lows. The tool labels the points and draws the connecting lines.
-
Verify Fibonacci ratios using the Measurement Tools (Quick Measure or Price Only). Measure the XA length, then check the AB retracement as a percentage; adjust the AB point if needed. Repeat for BC retracement and CD extension.
-
Plan the entry zone: Use a Horizontal Ray to mark the D level. For a bullish Gartley, set an Alert with trigger “Price crosses” at the D level (or just below it) to notify you when price enters the PRZ.
-
Simulate the trade: Use the Long/Short Tool to enter at the D level, place the stop at X, and add partial take-profit orders at B (high probability) and C (lower probability). The tool shows risk/reward ratios.
-
Draw Trendlines connecting X-A, A-B, B-C, C-D as a visual reference.
Limitation: TakeProfit does not automatically scan for Gartley patterns across the chart. The XABCD tool validates the shape you draw but does not check the Fibonacci ratios—you must verify those yourself using the measurement tools.
FAQ – based on common search queries
What is the Gartley 222?
A nickname from page 222 of H.M. Gartley’s 1935 book Profits in the Stock Market (Bulkowski, thepatternsite.com, August 2020). The pattern description in that book was a trend-continuation pullback, not a Fibonacci reversal.
What is the most powerful pattern in trading?
No single pattern is universally most powerful. Performance depends on market conditions and your timeframe. The Gartley is one of several harmonic reversal patterns.
Is harmonic trading profitable?
No independent academic study confirms consistent profitability. Bulkowski’s statistics suggest 98% of perfect Gartleys reach the B level, but this does not account for spreads, commissions, or slippage.
How accurate is harmonic trading?
Accuracy varies widely. The Gartley’s reported 98% B-target hit rate applies only to perfect, already-completed patterns in one researcher’s database. Real-time accuracy is lower.
What is the difference between a bullish and bearish Gartley?
Both share the same Fibonacci structure. A bullish Gartley forms in a downtrend and signals an upward reversal; a bearish Gartley forms in an uptrend and signals a downward reversal.
How do you trade a Gartley pattern?
Identify the five-point XABCD structure with correct ratios, enter at D after a reversal candle, stop beyond X, and target B (most common), A, or C.
Past performance, including the statistics cited, is not indicative of future results. All trading involves risk.
Learn how to use the XABCD Pattern Tool in TakeProfit → /docs/guide/platform/chart-widget/Pattern-tools.md
Related patterns: Double top and double bottom, Head and shoulders.
This article is educational and is not investment advice. To get notified when price closes beyond the level you drew, see TakeProfit’s alert trigger criteria.