Last updated: September 2025
Disclosure: The section on tracking the pattern uses TakeProfit‘s charting tools as a worked example; other charting platforms offer comparable drawing tools and price alerts.
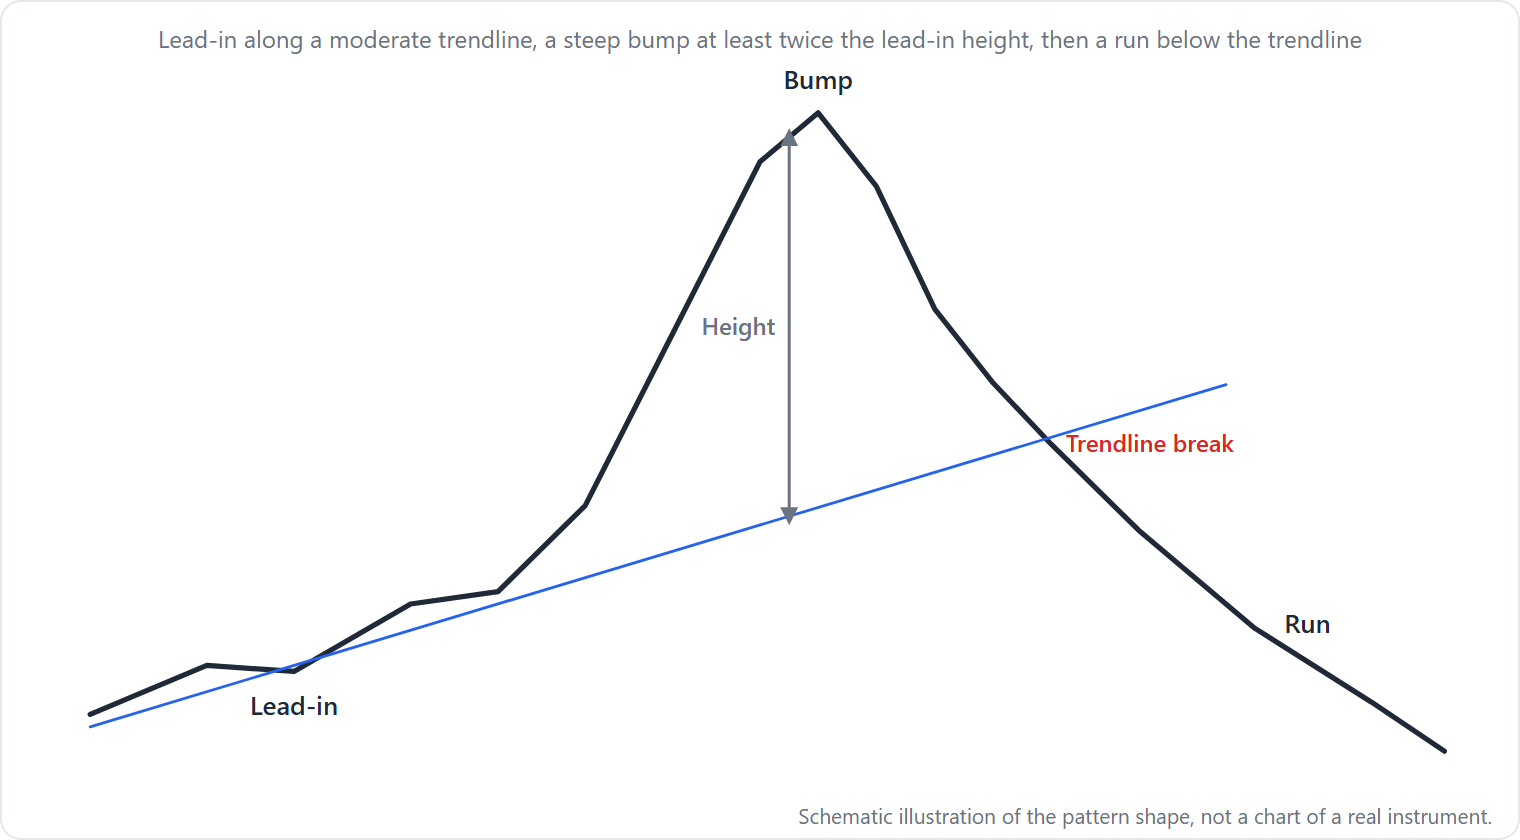
Quick answer: The bump and run reversal (BARR) is a three-phase chart pattern that signals the end of an unsustainable price move. It consists of a shallow lead-in trend, a steep accelerating bump, and a run back to and beyond the lead-in trendline.
At a Glance
| Attribute | Detail |
|---|---|
| Pattern type | Reversal (top and bottom variants) |
| Phase structure | Lead-in → Bump → Run |
| Lead-in slope | 0–45° (bottom), 30–45° (top) (Bulkowski, thepatternsite.com, July 2025) |
| Bump slope | ≥60° (bottom), 45–60° (top) |
| Minimum lead-in duration | At least one month, average 35 days |
| Bump height rule | At least twice the lead-in height |
| Confirmation | Close below (top) or above (bottom) the lead-in trendline |
| Sample size (top) | 1,488 perfect trades |
| Sample size (bottom) | 1,099 perfect trades |
| Dual bumps frequency | 18–21% (top), 12% (bottom) |
What Is the Bump and Run Reversal Pattern?
The bump and run reversal pattern is a three-phase formation discovered by Thomas Bulkowski in 1996 (Bulkowski, thepatternsite.com, July 2025). It appears as either a top (bearish) or bottom (bullish) reversal. The pattern captures a market that moves from an orderly trend into a speculative frenzy and then abruptly reverses back to the original trendline.
The name comes from the shape: after a calm, trend-bound “lead-in,” price accelerates steeply in the “bump” phase—propelled by excessive speculation or a favorable event—before rounding over and “running” back to the lead-in trendline. When price closes through that trendline, the reversal is confirmed. StockCharts frames the pattern as the result of “excessive speculation” that pushes price too far too fast (StockCharts ChartSchool). Bulkowski originally called it the “bump and run formation (BARF)” but changed the name.
How Do You Identify a Bump and Run Reversal Top?
A bump and run reversal top forms after an extended uptrend. You need to draw two trendlines: one for the lead-in and one for the bump.
Lead-in phase: Price follows a rising trendline with a slope of 30–45 degrees. The lead-in should last at least one month. Measure the lead-in height as the tallest vertical distance between the trendline and price in the first quarter of the pattern. Bulkowski says this height should be at least $1, preferably $2 or more, but this depends on the stock price (Bulkowski, thepatternsite.com, July 2025).
Bump phase: After a favorable event (earnings, upgrade), price accelerates higher following a steeper trendline of 45–60 degrees. Volume is typically high. The bump height—measured from the peak down to the 30-degree lead-in trendline—should be at least twice the lead-in height.
Downhill run: Price rounds over at the bump peak and eventually returns to the lead-in trendline. The pattern confirms as valid when price closes below that 30-degree trendline.
For the target, Bulkowski uses the bottom of the chart pattern as the price projection.
How Do You Identify a Bump and Run Reversal Bottom?
The bottom variant is a mirror image but with its own rules. Bulkowski describes the shape as “a frying pan, tilted down, with the handle on the left” (Bulkowski, thepatternsite.com, July 2025).
Lead-in phase: Price moves lower along a down-sloping trendline of 0–45 degrees. The lead-in lasts at least one month, averaging 35 days. The lead-in height measures from the trendline (drawn across the highs) to the handle low—the widest vertical distance in the first quarter.
Bump phase: The downtrend steepens to 60 degrees or more as price drops rapidly. Volume is high. The bump height (from trendline to lowest low) should be at least twice the lead-in height.
Uphill run: Price levels out, rounds upward, and eventually climbs back to the down-sloping lead-in trendline. Confirmation comes when price closes above that trendline.
The target is the highest high in the pattern (the top of the lead-in). Bulkowski ranks the bump and run reversal bottom as “best for performance in bull markets” and “second best for performance in bear markets” based on 1,099 perfect trades.
What Is the Psychology Behind the Pattern?
The bump and run reversal pattern reflects a shift from rational trend-following to speculative excess. During the lead-in phase, the trend is orderly—traders buy on pullbacks, and the slope is moderate. The bump phase begins after a catalyst (a strong earnings report, a rating upgrade, or a news event) that draws in momentum traders and latecomers. Volume surges as the crowd piles in.
At the bump peak, the buying exhausts. The move has become unsustainable. Smart money begins to distribute positions. Price starts rounding over, and when it returns to the original trendline, the last believers who bought the breakout are trapped. The close through the trendline confirms that the speculative move has ended and the old trend is broken.
For the bottom variant, the psychology is reversed: panic selling during the bump exhausts sellers, and the rounding bottom shows accumulation before price breaks back above the trendline.
How Do You Trade the Bump and Run Reversal Pattern?
The primary trade trigger is the close beyond the lead-in trendline. For the top variant, you enter short when price closes below the 30-degree trendline. For the bottom, you enter long when price closes above the down-sloping trendline.
Bulkowski recommends drawing a “warning line” parallel to the lead-in trendline, placed one lead-in height above it (for the top). This warns that price is entering the “sell zone”—the area between the warning line and the sell line. The sell line is another parallel line at twice the lead-in height. He suggests considering selling when price touches the sell line, especially if the bump is narrow rather than rounded (Bulkowski, thepatternsite.com, July 2025).
Entry: Confirmation required. Do not trade on an intrabar touch of the trendline—wait for the close.
Stop-loss: For a short trade on the top, place the stop above the bump peak or above the most recent swing high inside the bump. For a long trade on the bottom, place the stop below the bump low.
Target: Bulkowski’s measure rule for the top uses the bottom of the chart pattern as the target. For the bottom, the target is the highest high in the pattern.
Volume: Bulkowski notes that volume is high at the pattern’s start, at the bump start, and at the breakout. Increasing volume on the breakout adds conviction to the trade.
Worked Example: Bump and Run Reversal Top
Illustration: Assume a stock trading at $50. These are hypothetical round prices for teaching purposes.
Step 1: Identify the lead-in. Over six weeks, the stock rises from $50 to $55 along a 35-degree trendline. The lead-in height is $5 (the vertical distance from trendline to the lowest valley in the first quarter).
Step 2: Identify the bump. After a positive earnings surprise, the stock accelerates. It climbs to $85 over three weeks, following a 55-degree trendline. The bump height is $85 minus $55 (where the lead-in trendline projects at that date) = $30. This is six times the lead-in height ($30 / $5 = 6), satisfying the “at least twice” rule.
Step 3: Price returns to the trendline. Over the next two weeks, the stock rounds over and drops back to $57, near the lead-in trendline. Volume is heavy on the decline.
Step 4: Confirmation. On day 15, the stock closes at $54, below the lead-in trendline (which is at $56). The pattern is confirmed. You enter short at $54.
Step 5: Stop and target. The bump peak was $85, so you place a stop at $86 (above the peak). Bulkowski’s target is the pattern bottom, which is the lead-in start at $50. Risk: $86 – $54 = $32. Reward: $54 – $50 = $4. This trade shows poor risk-reward—Bulkowski’s rule suggests the target is the pattern bottom, but that may be too close. In practice, you might wait for a deeper retracement or use a trailing stop.
What Are the Failure Modes of the Pattern?
Even with Bulkowski’s large sample study, the pattern can fail in specific ways. Recognizing the failure modes on the chart helps you avoid premature entries.
Dual bumps: Bulkowski reports that 18–21% of BARR tops and 12% of BARR bottoms show a second bump after the first one returns to the trendline (Bulkowski, thepatternsite.com, July 2025). The chart shows price touching the lead-in trendline, then bouncing to form a new peak before finally breaking. If you enter on the first touch, you may get stopped out as price reverses to form the second bump.
Throwbacks and pullbacks after breakout: Bulkowski notes that “pullbacks hurt performance” for the top and “throwbacks hurt performance” for the bottom. On the chart, after the breakout through the trendline, price quickly returns to test the trendline from the other side. A throwback can stop out a tight stop and then resume in the intended direction, or it can fail entirely.
Breakout that does not sustain: The break through the lead-in trendline must be a close, not an intraday spike. If price closes below the trendline but then the next day gaps back above, the breakout has failed. This often happens during low-volume breakouts or when the lead-in trendline is too shallow (near horizontal) or too steep (over 60 degrees). Bulkowski warns to avoid patterns with steep (over 60-degree) trendlines.
How Does the BARR Compare to Look-Alike Patterns?
The bump and run reversal is frequently confused with other patterns.
| Pattern | How It Differs | Where to Read More |
|---|---|---|
| Head and shoulders | BARR has one accelerating bump, not three distinct peaks. The breakout is a trendline break, not a neckline break. | Head and Shoulders Pattern |
| Rounded top / rounded bottom | A rounded reversal lacks the shallow lead-in trendline and the bump height rule. The rounding is symmetric, not steepening. | Covered in rounding bottom pattern (future page) |
| Parabolic blow-off top | A parabolic advance is a single steep curve without the prior lead-in trendline. BARR requires the lead-in and the return to that trendline before the breakout. | Covered in island reversal pattern (future page) |
| Shallow trendline break | A simple trendline break has no bump phase. BARR requires the bump height to be at least twice the lead-in height. | Trendline drawing (future page) |
| Double top / double bottom | Two peaks or troughs with a neckline; BARR has one bump and a trendline. | Double Top and Double Bottom |
How Can You Trade the BARR with TakeProfit?
TakeProfit’s charting tools help you draw the pattern’s trendlines and set alerts for the breakout.
1. Draw the lead-in trendline. Use TakeProfit’s trendline tool to connect at least two swing lows (top) or swing highs (bottom) in the first month of the pattern. Adjust the angle until the line touches but does not cross the data.
2. Measure the lead-in height. Use the vertical distance measurement tool to find the widest gap between the trendline and price in the first quarter. Note this value.
3. Set the alert. Place a horizontal line at the lead-in trendline’s breakout level. Then use TakeProfit’s price alert to trigger when price closes beyond that level. Set the alert to “close outside” to avoid false intraday breaks.
4. Evaluate risk:reward. After the breakout, use TakeProfit’s Long/Short tool to plot the entry, the stop (above the bump peak or below the bump low), and Bulkowski’s target (pattern bottom for tops, pattern high for bottoms). The tool displays the risk-reward ratio automatically.
Limitation: TakeProfit does not automatically recognize the BARR pattern. You must draw the lead-in trendline and measure the heights manually. The alert watches a level you set rather than detecting the full three-phase structure. For multi-bump variants, you may need to redraw the trendline after the second bump appears.
FAQ
How reliable is the bump and run reversal pattern? Bulkowski’s studies of 1,488 top trades and 1,099 bottom trades (thepatternsite.com, July 2025) rank the BARR bottom first in bull markets and the top as an excellent performer. No single study provides an exact percentage success rate for the pattern.
What timeframe is best for the bump and run pattern? Bulkowski recommends at least a one-month lead-in (average 35 days), so daily charts work well. The pattern can also appear on weekly or monthly charts, but the identification rules remain the same.
Can you trade the bump and run pattern in forex? Secondary sources extend BARR to forex (TradeTaurex, July 2026), but Bulkowski’s original research centered on US equities. No authoritative asset-class study specific to BARR in forex has been published.
Where should I place my stop loss? For a top, place the stop above the bump peak or the most recent swing high inside the bump. For a bottom, place it below the bump low. Adjust for volatility—a 2–3 ATR stop beyond the peak/low is common among experienced traders.
What Are the Bump and Run Reversal Pattern Variants?
Bulkowski treats the top and bottom as distinct variants with separate statistics and rules. The top variant has a 30–45° lead-in and a 45–60° bump; the bottom has a 0–45° lead-in and a 60°+ bump. The confirmation direction is opposite: close below for the top, close above for the bottom.
Secondary sources sometimes discuss BARR on weekly or monthly charts, but those time-frame claims are not shown in the authoritative excerpts gathered here (Bulkowski, thepatternsite.com, July 2025). The pattern also appears after event-driven spikes in equities (earnings, upgrades).
Conclusion and Summary
The bump and run reversal pattern gives you a disciplined structure for trading trend reversals: lead-in, bump, run, and a confirmed close beyond the trendline. Bulkowski’s empirical work provides specific angle ranges, the 2× height rule, and dual-bump frequency statistics. No single success rate exists for the pattern, but its performance rank is high. The three most common failure modes—dual bumps, throwbacks, and non-sustaining breakouts—can each be identified on the chart before you enter a trade.
This page is educational and does not constitute investment advice. For a step-by-step tutorial on setting up breakout alerts and measuring lead-in height with TakeProfit’s charting tools, visit the TakeProfit documentation.