Last updated: October 2026
Disclosure: The section on tracking the pattern uses TakeProfit‘s charting tools as a worked example; other charting platforms offer comparable drawing tools and price alerts.
Quick answer: A rounding bottom (saucer bottom) is a long-term U-shaped reversal pattern that forms after a downtrend, confirmed when price closes above the left rim. The rounding top is its bearish counterpart—an inverted bowl after an uptrend that warns of a downward reversal. Both require weeks to months of development and increasing volume on the right side.
At a glance
| Attribute | Rounding Bottom | Rounding Top |
|---|---|---|
| Type | Bullish reversal (or continuation 67% of the time per Bulkowski) | Bearish reversal |
| Signal direction | Upward (buy) | Downward (sell short) |
| Where it forms | After a downtrend or upward drift | After an uptrend |
| Typical duration | Several weeks to many months (StockCharts ChartSchool, July 2024) | Several weeks to months (Bulkowski, thepatternsite.com, August 2020) |
| Confirmation trigger | Close above the left rim (reaction high) | Close below the lower of the two rims (Bulkowski, August 2020) |
| Entry trigger | Close above left rim | Close below lower rim (downward breakout) |
| Stop placement | Below the lowest valley of the bowl | Above the highest peak |
| Target method | Add bowl height (left lip to valley) to right lip | Add or subtract height (peak to right rim low) to breakout point |
| Most common failure | Mid‑pattern bump‑up that retraces | Throwback/pullback after breakout |
Rounding bottom pattern
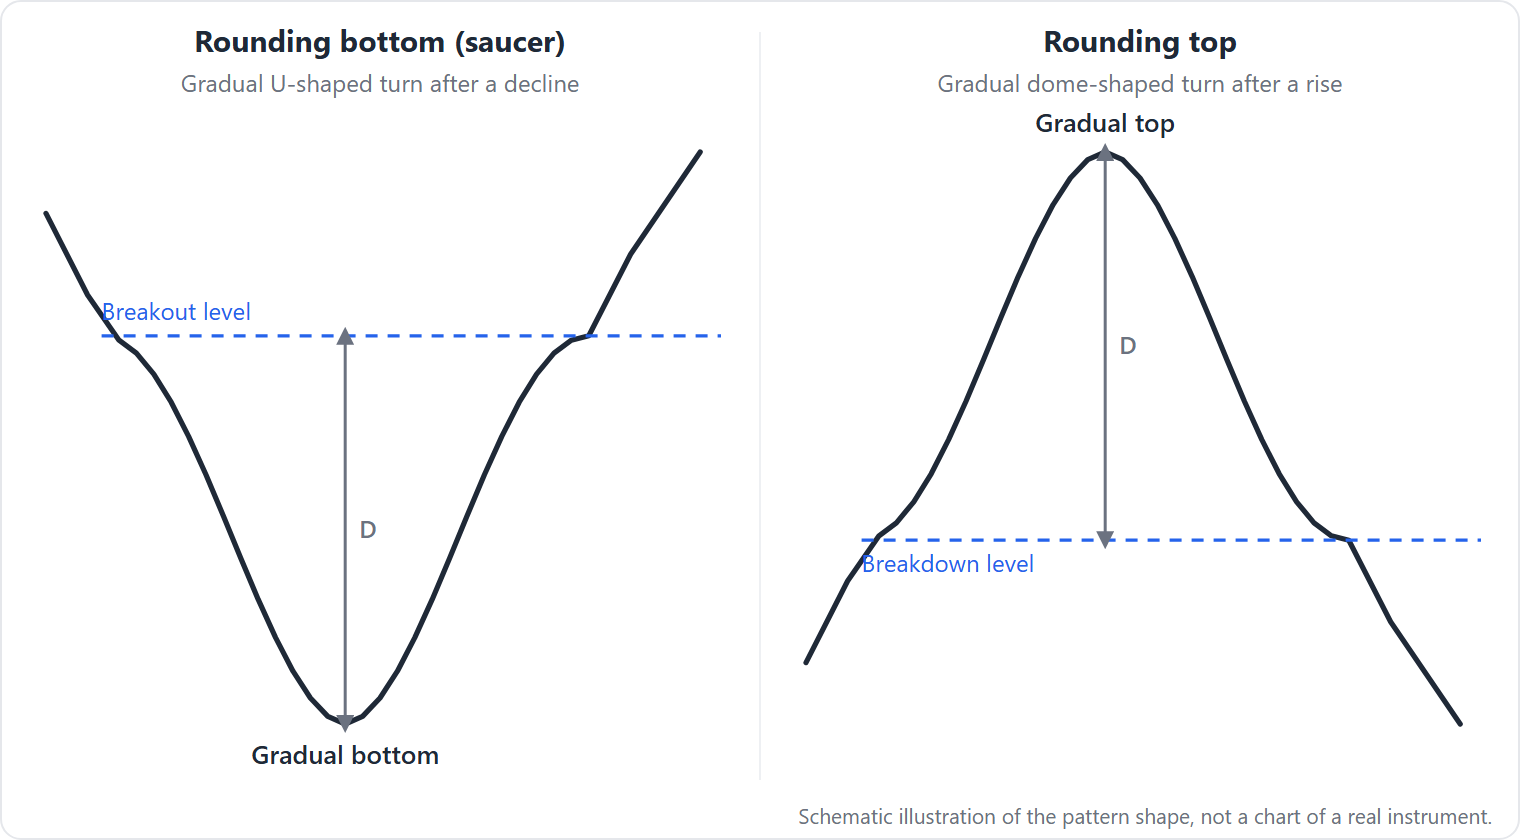
The rounding bottom is a bullish reversal pattern that forms after a downtrend, though Bulkowski found that 67% of the time price actually trends upward before the pattern, meaning it often acts as a continuation (Bulkowski, thepatternsite.com, August 2020). It appears as a rounded bowl shape on weekly charts.
Checklist:
1. Prior trend: Price trending downward or sideways into the pattern.
2. Shape: Rounded bowl, not a sharp V. StockCharts advises the low “should not be too sharp” and should take at least a few weeks to form (StockCharts ChartSchool, July 2024).
3. Duration: Several weeks to many months (StockCharts, July 2024; Bulkowski, August 2020).
4. Volume: Ideally high at the decline start, low near the bottom, and rising on the advance (StockCharts, July 2024).
5. Breakout: Confirmation on a close above the left rim (the reaction high). Bulkowski explains, “I use a close above the left peak because price on the right might not pause at a minor high” (Bulkowski, August 2020).
Rounding top pattern
The rounding top is a bearish reversal pattern that forms after an uptrend. It appears as an inverted bowl on weekly or daily charts.
Checklist:
1. Prior trend: Clear uptrend (Bulkowski, August 2020).
2. Shape: Inverted bowl with two rims roughly at the same level; 58% of the time the right rim is slightly higher.
3. Duration: Large enough to appear on weekly or daily charts.
4. Breakout: Downward breakout is a close below the lower of the two rims; upward breakout is a close above the highest high.
5. Volume: Heavy volume on breakout suggests better performance.
Disagreement between sources: StockCharts frames the rounding bottom as a pure reversal pattern, while Bulkowski’s study finds it acts as a continuation 67% of the time. The distinction matters for context: if price is already rising before the breakout, the measured target is more likely to be met but the “reversal” label may mislead.
Why these patterns form
The rounding bottom’s gradual U‑shape reflects a slow exhaustion of selling pressure. Sellers become less aggressive, allowing price to stabilize, then buyers step in more forcefully. The volume pattern—high at the start, low at the bottom, rising on the right—reinforces the shift from bearish to bullish sentiment. The rounding top shows the opposite: buying fatigue, distribution, and a slow transition to selling. Bulkowski notes that midway through the turn price may “shoot up only to drop back down,” indicating that the bottoming process often involves a false start (Bulkowski, August 2020). These interpretations are qualitative; no causal mechanism has been proven in academic studies (StockCharts, July 2024; Bulkowski, August 2020).
Trading the rounding bottom
Entry: Buy on a close above the left rim. Some traders wait for a volume spike or a close above the rim by more than a minimal amount.
Stop placement: Below the lowest valley of the bowl. The exact distance depends on risk tolerance and volatility.
Target method (measure rule): Compute the height from the left saucer lip to the lowest valley. Add this height to the right saucer lip to get a target. If no clear right lip, use the left rim (Bulkowski, August 2020). The target can be multiplied by a “percentage meeting price target” factor from Bulkowski’s study.
Worked example — Illustration:
Assume a weekly chart with the following hypothetical levels:
– Left rim: $50.00
– Valley bottom: $40.00
– Right rim: $52.00
- Height = left rim − valley = $50.00 − $40.00 = $10.00
- Target = right rim + height = $52.00 + $10.00 = $62.00
If price closes above $52.00, a trader enters long with a stop below $40.00. The target of $62.00 implies a potential gain of about 19% from the $52.00 entry. This is a hypothetical illustration, not a real trade or backtest.
Busted setup: Bulkowski describes a busted rounded bottom: if price breaks down, drops no more than 10%, then reverses and closes above the top of the pattern, it can be traded as a reversal (Bulkowski, thepatternsite.com, October 2025).
Trading the rounding top
Entry: Sell short on a close below the lower rim. For aggressive buyers, Bulkowski suggests a 32% retrace rule: measure the height from the highest peak (A) to the right rim low (B), take 32% of that height, add it to B to get a buy price (Bulkowski, August 2020).
Stop placement: Above the highest peak.
Target method: Measure the height from A to B. For a downward breakout, subtract the height from B to get the target. For an upward breakout, add the height to A.
What the evidence says
Bulkowski’s research on rounding bottoms uses 990 “perfect” trades and finds the break‑even failure rank small and the average rise large (Bulkowski, August 2020). For rounding tops, he analyzed more than 950 perfect trades. Tall patterns perform better than short ones; heavy breakout volume suggests better performance; throwbacks and pullbacks hurt post‑breakout results. When the right rim is above the left (58% of cases), the pattern underperforms.
When it fails
-
Mid‑pattern bump‑up (rounding bottom): Bulkowski warns that price may “shoot up only to drop back down” midway through the turn (Bulkowski, August 2020). On the chart, a sharp rally near the bottom retraces most of the gain. If it extends below the valley, the pattern is invalid. More likely when volume spikes prematurely.
-
False breakout on low volume (both patterns): StockCharts emphasizes that volume should rise on the right side (StockCharts, July 2024). A breakout above the left rim on below-average volume has a higher chance of reversing (throwback). In range-bound markets, false breakouts are more common.
-
Rounding top with right rim above left: Bulkowski’s data shows that when the right rim is above the left (58% of cases), the pattern underperforms. The chart shows an asymmetrical right side higher than left. Traders may enter a short that never reaches target.
-
Throwback/pullback after breakout (both patterns): Bulkowski reports that throwbacks hurt post‑breakout performance. After an initial breakout, price may retreat to the breakout level, reducing the average rise.
Look-alikes
| Pattern | How it differs | Where to read more |
|---|---|---|
| Cup‑and‑handle | Has a distinct handle (shallow downward drift on low volume) at the right lip; rounding bottom has no handle and its right side rises gradually. Duration often shorter than saucer bottoms. | Cup and Handle Pattern |
| Double bottom | Forms two distinct V‑shaped troughs at nearly the same price level, separated by a rally. Rounding bottom is a single smooth bowl without two separate lows. | Double Top and Double Bottom |
| V‑bottom | Sharp, short‑lived reversal with a pointed low; rounding bottom’s low is gradual over weeks or months. Volume in V‑bottom spikes at the low rather than contracting. |
Tracking rounding bottom and rounding top patterns in TakeProfit
Step‑by‑step with TakeProfit tools:
- Mark the structure – Use the Horizontal Ray to draw lines along the left and right rims. The Trend Angle tool can help confirm the sides are gradual; a very steep angle (>45°) suggests the pattern may be too sharp for a valid rounding bottom.
- Set a breakout alert – Place a price alert at the left rim level. When price closes above that level, the alert system notifies you.
- Visualize the trade – Use the Long‑Short Tool (Alt+L) to set entry at the breakout level, stop below the valley, and target based on the measured move. The Risk Ratio mode shows the reward‑to‑risk ratio automatically.
- Backtest manually – Use the Standard Line tool to draw the pattern on historical charts. Step through past data.
TakeProfit does not automatically detect rounding bottoms or rounding tops; the trader must visually identify the shape and draw the levels manually. This is a limitation.
FAQ
What does a rounding bottom pattern signify?
It signals that selling pressure is exhausting and buyers are gradually returning. A long‑term reversal pattern that takes weeks to months (StockCharts, July 2024).
Is a rounding bottom bullish or bearish?
Generally considered a bullish reversal. However, Bulkowski found 67% of the time price trends upward before the pattern, so it can also act as a continuation (Bulkowski, August 2020).
How long does a rounding bottom take to form?
Several weeks to many months. Weekly charts make the rounded shape easiest to see (StockCharts, July 2024; Bulkowski, August 2020).
What is the difference between a rounding bottom and a cup and handle?
A cup‑with‑handle has a distinct handle after the right side rises; the rounding bottom lacks a handle and its right side rises directly.
Where do you set the profit target?
The target is the right lip price plus the bowl height (left lip minus valley), multiplied by a percentage factor from Bulkowski’s study.
What is the success rate?
No peer‑reviewed study gives a universal success rate. Bulkowski’s practitioner study of 990 trades shows the break‑even failure rank is small, but success definitions vary.
Conclusion
Related patterns: Head and shoulders.
This article is educational and is not investment advice. To get notified when price closes beyond the level you drew, see TakeProfit’s alert trigger criteria.