Last updated: September 2026
Disclosure: The section on tracking the pattern uses TakeProfit’s charting tools as a worked example; other charting platforms offer comparable drawing tools and price alerts.
Quick answer: A double top (M) and double bottom (W) are reversal patterns: two similar peaks or troughs with an intervening swing. A top completes on a close below that swing’s low; a bottom on a close above its high, per ChartSchool: Double Top and Double Bottom.
At a glance
| Attribute | Detail |
|---|---|
| Type | Reversal: Double Top (bearish), Double Bottom (bullish). |
| Signal direction | Down after an M top; up after a W bottom. |
| Where it forms (trend context) | At resistance after an uptrend (top); at support after a downtrend (bottom). |
| Typical duration/spacing | On daily charts, most Eve & Eve double tops show peaks 2–6 weeks apart and most Eve & Eve double bottoms 2–7 weeks apart (Bulkowski, Eve & Eve Double Top; Eve & Eve Double Bottom; accessed September 2026). |
| Confirmation | A close through the neckline (below the valley for tops; above the peak for bottoms) completes the pattern. |
| Entry trigger | The confirmation close; some traders wait for a neckline retest that holds. |
| Stop placement | Commonly just beyond the second peak (top) or second trough (bottom), with a volatility buffer; Bulkowski also suggests below the lower of the two lows for some bottom subtypes (Adam & Adam Double Bottom; accessed September 2026). |
| Target method | Measured move: height from neckline to the extreme, projected from the neckline. |
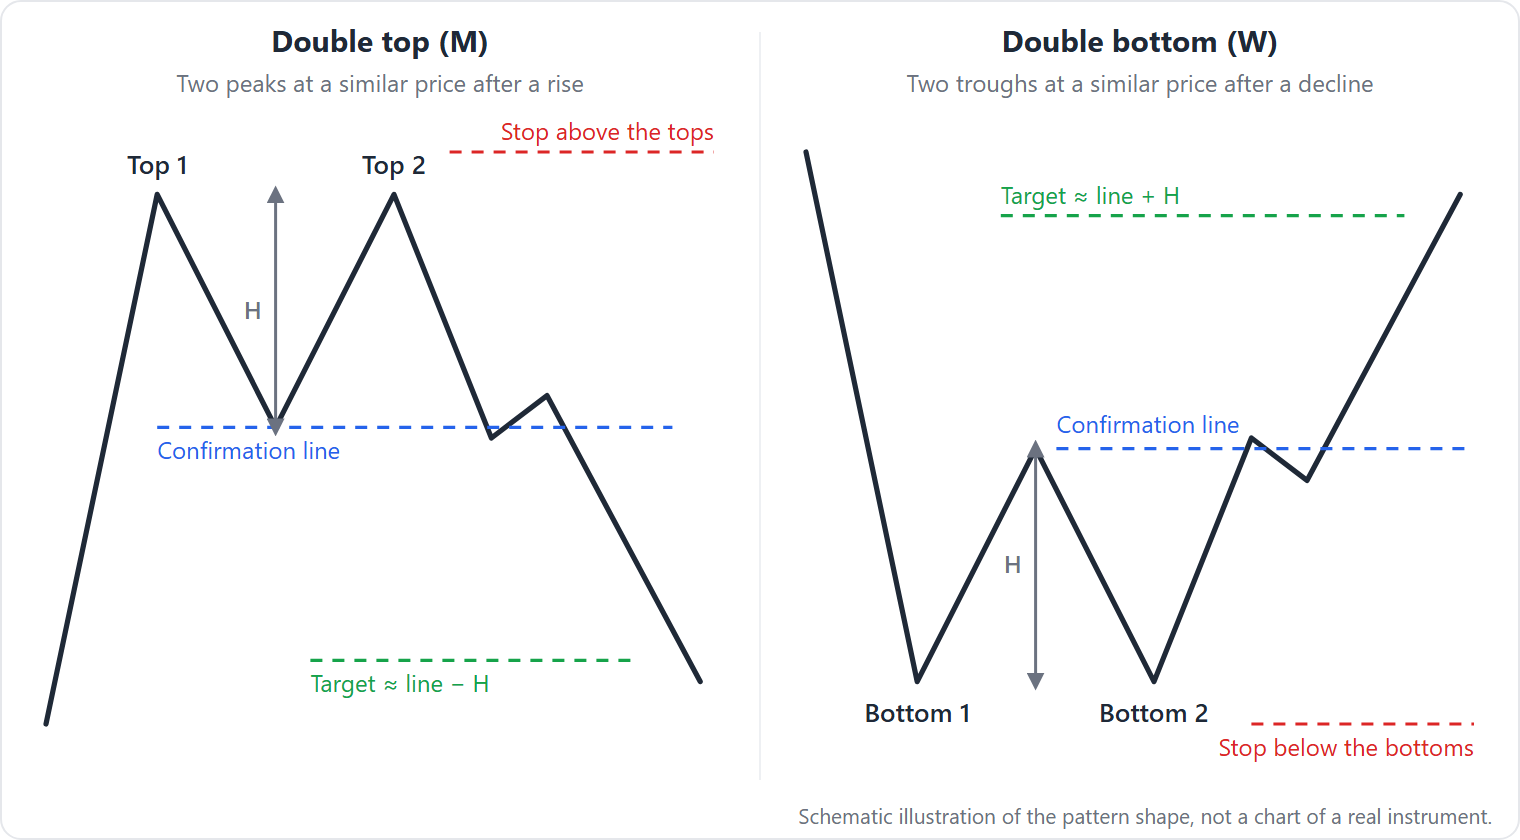
How to identify the double top and double bottom pattern
A double top/double bottom is defined by two similar extremes separated by a swing (the neckline) and is considered complete only when price closes through that neckline. A top needs an uptrend; a bottom needs a downtrend (ChartSchool; accessed September 2026). This is the classic double top formation and its bullish mirror.
Checklist on a daily chart (pattern confirmation by closing price):
– Prior trend: tops follow an advance; bottoms follow a decline (ChartSchool).
– Symmetry at the extremes:
– Double tops: peak variation is often under 3% (Bulkowski, Eve & Eve Double Top; accessed September 2026).
– Double bottoms: subtype tolerances differ—Eve & Eve 0–6% and Eve & Adam 0–4%; Adam & Adam averages ~1% (Bulkowski: Eve & Eve, Eve & Adam, Adam & Adam pages; accessed September 2026).
– Neckline: draw at the lowest low between peaks (top) or highest high between troughs (bottom); that level defines pattern confirmation.
– Spacing: on daily charts, most valid double-top and double bottom patterns have extremes several weeks apart; structures formed in just a few days are usually noise (Bulkowski subtype pages).
– Volume tendencies: bottoms often show higher volume on the left trough and a downward volume trend into the second trough (Bulkowski, Eve & Adam Double Bottom; accessed September 2026).
– Confirmation: many traders wait for a candle close through the neckline on their working timeframe. An intrabar pierce is not a signal.
– Expect differences across sources: ChartSchool’s “roughly equal” approach contrasts with Bulkowski’s subtype ranges; his pages may differ due to sample construction and updates (Bulkowski: Double Bottom Types; accessed September 2026).
– Optional filters: some add momentum divergence (for example, MACD/RSI) as a secondary check. These are not required by classical definitions.
Why the double top and double bottom pattern forms
Double tops and double bottoms form when supply persists at resistance or demand persists at support through two tests, and a closing break of the neckline signals control has shifted. Two failures at the same level followed by that break mark the turn (ChartSchool; accessed September 2026).
Behaviorally, the second test often traps late entries expecting continuation. On tops, a second failure at resistance prompts profit‑taking and new shorts. On bottoms, a second support hold plus a neckline break forces shorts to cover and invites new longs. Bulkowski also notes many tops appear after straight‑line runs and, once confirmed, often retrace toward the prior “launch” area (Bulkowski, Double Top Study; accessed September 2026). This price‑action narrative shows up across asset classes, including equities and the pattern in forex trading.
How traders trade the double top and double bottom pattern
The trading strategy is typically to wait for pattern confirmation, set stops beyond the second extreme, and use a measured move for the first target. Pre‑confirmation entries raise failure risk.
- Entry: enter short on a top when price closes below the neckline; enter long on a bottom when price closes above it. Many wait for a neckline retest that holds.
- Stop: place beyond invalidation. Common placements are just above the second peak (top) or just below the second trough (bottom), with a volatility buffer. Bulkowski suggests below the lower of the two lows for some bottom subtypes.
- Target: use a measured move—the vertical distance from the neckline to the extreme—projected from the neckline.
Illustration (hypothetical example):
– Suppose a double bottom forms with troughs near 40 and a neckline at 48.
– Confirmation close: 49 (above 48).
– Height = 48 − 40 = 8. Measured target projected from the neckline: 48 + 8 = 56.
– Entry at 49; stop below the second trough at 39.50 (50 cents buffer).
– Risk per share = 49 − 39.50 = 9.50.
– Reward to the first target = 56 − 49 = 7.00.
– R multiple to the first target = 7.00 / 9.50 ≈ 0.74R.
– If instead entering on a successful retest at 48.20 with the same stop at 39.50, risk per share = 8.70; reward = 56 − 48.20 = 7.80; R ≈ 0.90R.
Illustrative only; excludes fees, spreads, slippage, and assumes ideal fills. Actual R multiples vary with entry, stop placement, volatility, and whether price continues past the measured objective.
What the evidence says about the double top and double bottom pattern
Bulkowski’s subtype pages report U.S. equity results on daily data using “perfect trades.” For Eve & Eve double tops, the page lists a break‑even failure rate of 20% and an average decline after breakout of 16%. It also reports a pullback rate of 65% and 43% meeting the measured target. These figures are based on 942 perfect trades in U.S. equities, daily data, drawn from a multi‑decade sample; exact years are not published on the page (Bulkowski, Eve & Eve Double Top).
For Eve & Eve double bottoms, the page reports an overall performance rank of 5/39 among bullish patterns and a break‑even failure rate of 12%. It also shows an average rise of 50%, a throwback rate of 65%, and 65% meeting the measured target. These are based on 952 perfect trades in U.S. equities, daily data, over a multi‑decade sample; exact years are not published (Bulkowski, Eve & Eve Double Bottom).
These statistics come from Bulkowski’s detection rules applied to U.S. equities and daily data. Independent replications using identical definitions are limited in the public domain, and “perfect trades” exclude costs and slippage and assume idealized execution.
When the double top and double bottom pattern fails—modes and tells
The pattern most often fails in these observable ways:
– Post‑break retest whipsaw: after confirmation, price returns to the neckline. Bulkowski records a throwback rate near 65% for Eve & Eve double bottoms (n=952; period not stated) and a 65% pullback rate for Eve & Eve double tops (n=942; period not stated). On charts, the breakout candle is often followed by a retest that can stop out tight positions.
– Range context: a shallow prior trend or choppy, low‑volume conditions can produce small or failed moves. Charts often show narrow swings, thin breakout volume, and frequent neckline reclaims.
– Morphing: without confirmation, structures frequently evolve into rectangles or triple‑test ranges. A third test can appear at the same level, or price can oscillate between extremes with no decisive close beyond the neckline.
A common tell in double tops is a straight‑line run into the pattern. After confirmation, price often retraces toward the “launch” area, and failure to push past that area can mark exhaustion of the reversal leg (Bulkowski’s Double Top Study; accessed September 2026).
Look‑alikes — quick compare
Double tops/bottoms can resemble other structures. Use the neckline close and the number of tests to confirm.
| Pattern | How it differs | Where to read more |
|---|---|---|
| Rectangle (trading range) | Multiple swings between horizontal support and resistance; no confirmed close beyond the range. A double tests twice then breaks. | Edwards & Magee, Technical Analysis of Stock Trends (book) |
| Triple Top/Bottom | Three distinct tests of the same resistance/support. Classification shifts from double to triple when a third peak/trough forms. | Edwards & Magee (book); ChartSchool pattern overviews |
| Head and Shoulders (inverse for bottoms) | Three extremes with a distinct higher head (top) or lower head (bottom); doubles have two similar extremes. | See our guide: Head and Shoulders (incl. inverse) |
| Cup and Handle | Rounded single U‑shaped base with a handle; lacks two discrete troughs or peaks of similar height. | See our guide: Cup and Handle |
Point‑and‑figure “double top breakout” or “double bottom breakdown” are continuation alerts under different rules and are not the classical reversal patterns discussed here (StockCharts ChartSchool: P&F pattern alerts; accessed September 2026).
Tracking the double top and double bottom pattern in TakeProfit
Disclosure (platform section): This section uses TakeProfit’s tools. Honest limitations: as of September 2026, automatic double‑top/double‑bottom recognition is not documented; you draw and measure the pattern manually. Alerts watch a price level you set; they do not “recognize” the pattern. The Long‑Short Tool plans risk/reward and sizing but does not place orders. Some platforms advertise scanners (for example, on TradingView or other charting suites); TakeProfit’s docs do not publish such a feature for this pattern.
TakeProfit basics (neutral, tool‑level):
– Mark the confirmation level: add a horizontal line at the valley (for tops) or the peak (for bottoms).
– Measure the setup: use price/time measurement to gauge separation between extremes and the height for a measured target.
– Plan the trade: the Long‑Short Tool lets you set entry at the confirmation level, place the stop beyond the second extreme, and project a target using the measured move. It displays risk/reward and supports account‑based sizing.
– Optional: set an alert at the confirmation price so you are notified if a pattern in your watchlist confirms. Alerts monitor the level you choose.
A candid summary: you get precise drawing, measurement, sizing, and level‑based alerts; pattern confirmation and recognition remain trader‑driven.
FAQ
-
Is a double top bullish or bearish?
Bearish. The double‑top chart pattern completes on a close below the trough between the two peaks (ChartSchool: Double Top Reversal; accessed September 2026). -
Is the W pattern bullish or bearish?
Bullish. The W is a double bottom, and it confirms on a close above the peak between troughs (ChartSchool: Double Bottom Reversal; accessed September 2026). -
What comes after a double top?
Bulkowski reports that many confirmed tops occur after straight‑line runs and often retrace toward the prior launch area before stabilizing (Double Top Study; accessed September 2026). -
What is the “success rate” of a double top?
Start with failure rates and assumptions. In Bulkowski’s “perfect trade” backtests for Eve & Eve Double Tops, the break‑even failure rate is 20% and 43% met the measured target (n=942; U.S. equities; daily; exact years not published). “Perfect trades” exclude costs and slippage and assume idealized entries/exits, so real‑world results vary. -
And for double bottoms?
Eve & Eve Double Bottoms show a 12% break‑even failure rate and 65% reaching the measured target (n=952; U.S. equities; daily; exact years not published). Subtypes differ (for example, Adam & Adam and Eve & Adam have different measured‑target hit rates). Definitions, samples, and updates matter. -
How do you trade these reversals?
Wait for the pattern confirmation close through the neckline or a neckline retest that holds; place the stop beyond the second extreme; target a measured move. Treat confirmation as the trigger, not an intrabar wick. -
How to set SL and TP?
Stops commonly go just beyond the second peak/trough (with a volatility buffer) or, for some bottom subtypes, below the lower of the two lows. Targets use the pattern’s height projected from the neckline.
This article is educational and not investment advice.
Ready to set level alerts for pattern confirmations? See TakeProfit docs: Alert trigger criteria.