Last updated: September 2026
Disclosure: The section on tracking the pattern uses TakeProfit’s charting tools as a worked example; other charting platforms offer comparable drawing tools and price alerts.
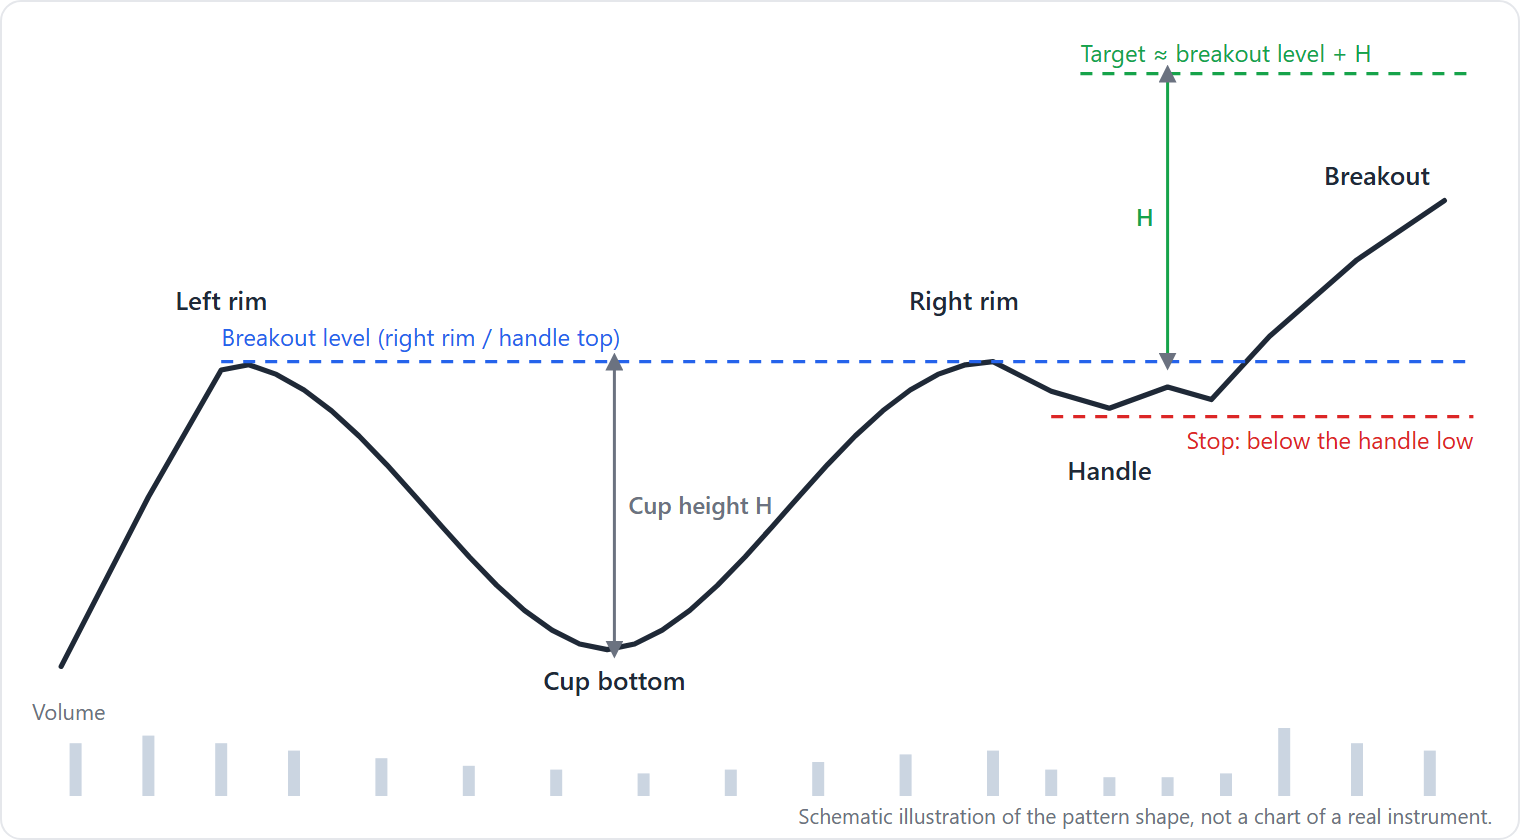
Quick answer: The cup and handle (cup‑with‑handle) is a bullish continuation chart pattern in technical analysis: a U‑shaped cup plus a shorter, shallower handle in the cup’s upper half. The signal completes on a move or close above the handle peak/right rim with stronger trading volume. A common target adds the cup’s height to the breakout point. StockCharts ChartSchool
Cup and handle pattern at a glance
| Attribute | Detail |
|---|---|
| Type | Bullish continuation base after an advance. Fidelity |
| Signal direction | Up, after an upside move above the handle/right rim (Fidelity). |
| Where it forms (trend context) | After a prior uptrend; O’Neil’s rule prefers a ≥30% prior run‑up before the base (MarketSmith). |
| Typical duration or timeframe | Cups often last 7–65 weeks on weekly charts; handles are shorter with a 1‑week minimum. Bulkowski |
| Confirmation | A breakout/close above the handle’s peak or right cup rim, ideally with higher volume (MarketSmith). |
| Entry trigger | Buy stop slightly above the handle peak or wait for a close above it (Fidelity). |
| Stop placement | Common: just below the handle low; conservative: below the cup bottom. TitanFX Bulkowski (pattern pairs) |
| Target method | Add the cup’s height (right rim to bottom) to the breakout (“pivot”). Investopedia |
| Most common failure | Post‑breakout throwbacks are frequent in catalog studies and can hurt results; weak breakout volume is a common issue (Bulkowski; MarketSmith). |
Cup and handle pattern identification — rules and gray areas
Identification centers on a rounded U‑shaped cup after an uptrend, then a shorter, shallower handle in the upper half, and finishes with an upside breakout above the handle peak/right rim.
Checklist with source‑backed thresholds:
1) Prior uptrend. O’Neil’s convention is a prior run‑up of at least 30% before a base qualifies as a cup‑with‑handle (MarketSmith).
2) Cup is U‑shaped, not V‑shaped. A rounded bowl is preferred; sharp V‑bottoms are rejected (StockCharts ChartSchool; Fidelity).
3) Cup duration. On weekly charts, cups commonly span 7–65 weeks; handles have a 1‑week minimum. Bulkowski
4) Cup rims near the same level. Equal left/right highs are ideal but not required; “close to prior highs” is acceptable (Fidelity).
5) Handle position and minimum duration. The handle should form in the upper half of the overall base and last at least about a week on daily charts. StockCharts ChartSchool
6) Handle depth. Typical guidance is “no more than roughly one‑third” of the cup’s advance; shallower is usually preferred (StockCharts ChartSchool; Fidelity).
7) Volume behavior. Trading volume often fades into the cup bottom and during the handle, then expands on the breakout (Investopedia; MarketSmith).
8) Confirmation. Many require a daily/weekly close above the handle peak or right rim to complete the pattern. Fidelity
Disagreements to note:
– Depth ranges. O’Neil‑derived materials emphasize typical 12–33% corrections (allowing deeper cases up to about half in volatile markets); some chart guides tolerate up to two‑thirds in extremes (MarketSmith; StockCharts ChartSchool).
– Timeframes. O’Neil’s canonical bases are multi‑week on weekly charts; daily/intraday versions exist but are noisier (StockCharts ChartSchool).
Practical gray‑area tests traders apply:
– Handle slope and placement. Many guides prefer a handle that drifts slightly downward and stays in the upper half; a sharp, deep, or upward‑sloping handle can signal sellers remain in control (StockCharts ChartSchool; Fidelity).
– Rim alignment and shakeouts. Slight overshoots or undershoots of the left rim can occur; what matters is that price returns near prior highs before forming the handle, not exact symmetry (Fidelity).
– U vs. V bottoms. Rounded bowls suggest a period of balance and accumulation; fast V‑shaped rebounds lack that “base‑building” and are treated with caution (StockCharts ChartSchool).
– Time compression. Short, one‑week handles can qualify. Ultra‑brief pauses that resemble a single‑day pullback are typically not counted as a handle (StockCharts ChartSchool).
Short variant — inverted cup and handle (bearish): The mirror image is a rounded top with a right‑side handle that must not overrun the cup top; handles often retrace 30–60% of cup height. Confirmation comes on a close below the right rim. Bulkowski’s measure rule subtracts the handle height from the right rim low to project a target. Bulkowski (inverted)
Why a cup and handle forms: an interpretation
Many writers frame the cup and handle as profit‑taking, consolidation, and renewed demand. Sellers control the left side of the cup. Balance emerges at the bottom. Buyers regain control on the right, and “overhead supply” near old highs creates a final, shallow handle before an upside push on higher volume (O’Reilly; MarketSmith).
This explanation is an interpretive supply‑demand narrative, not a mechanistic proof. The U‑shaped recovery lets weak‑hand sellers exit and stronger hands accumulate as volatility and volume often contract. The handle then acts as a last shakeout and a test of overhead supply. A decisive move through resistance with visibly stronger volume suggests supply has been absorbed and demand can carry price into new high ground (MarketSmith; StockCharts ChartSchool).
How traders use the cup and handle — entries, stops, targets
Entries typically trigger on an upside break or close above the handle peak/right rim (“pivot”), ideally with volume expansion (Fidelity; Investopedia). These trading strategies often include a measured‑move target and predefined risk.
Common risk controls:
– Stops: Many place a stop just below the handle low. A more conservative plan uses a stop under the cup bottom. TitanFX Bulkowski (pattern pairs)
– Targets: A widely used guideline adds the cup’s height to the pivot to estimate the objective. Investopedia
Trade management nuances:
– Early entries vs. confirmation. Some traders take an early entry on a break of a short, downward trendline drawn across handle highs. Others wait for a decisive close through resistance to reduce false breakout risk (Fidelity; StockCharts ChartSchool).
– Volume as a filter. “Stronger” breakout volume means clearly above the quieter handle activity. Many want a visible expansion relative to recent sessions rather than a marginal uptick (MarketSmith; Investopedia).
– Handling throwbacks. Throwbacks to the pivot are common in catalog studies and can hurt results. A planned stop just below the handle low helps avoid being shaken out by routine retests while still cutting a true failure (Bulkowski; MarketSmith).
– Targets as guidelines. The measured move is an estimate, not a promise. Some take partial profits near the projection and trail a stop on the remainder in case momentum continues (Investopedia).
Illustration:
– Suppose the left and right rims are both $50, and the bottom of the cup is $40. Cup height = $50 − $40 = $10.
– The handle peaks at $49.50. A trigger might be a move to $49.60–$50.00, with many waiting for a $50.00 close (Fidelity).
– Entry: $50.00.
– Handle low is $47.60; stop just below at $47.50 (risk per share = $2.50). TitanFX
– Target: $50.00 + $10.00 = $60.00 (Investopedia).
– Reward per share = $10.00.
– Risk/reward ratio = 1 : 4.
What the evidence says: stats and criticism
Thomas Bulkowski (U.S. stocks) reports that in a study of 300 cup‑with‑handle patterns from 1990 to March 2024, 47% “dropped substantially within two months” after an upward breakout; he also notes that throwbacks hurt performance. His page uses the phrase “dropped substantially” and points to a glossary for definitions; the specific numeric cutoff is not stated next to the 47% figure on the public page. Bulkowski
No peer‑reviewed, cup‑specific tests are cited here. The NBER working paper by Lo, Mamaysky, and Wang (1962–1996) shows that certain automatically detected chart patterns can be informative using kernel methods, but it does not isolate the cup‑and‑handle formation. NBER (Lo, Mamaysky, Wang, 2000)
Guides broadly agree on structure, confirmation, and risk controls but disagree on permissible depth and timeframe. Measured‑move targets are guidelines, not guarantees (StockCharts ChartSchool; Investopedia). Outcomes vary by market regime, instrument universe, and parameter choices; execution details such as waiting for a close, insisting on stronger volume, or accepting a throwback retest can materially affect real‑world results (MarketSmith; Fidelity).
Cup and handle failures — specific failure modes
Failures cluster around structure, volume, and context.
- Low‑half handles. If the handle drops into the lower half of the cup, O’Neil‑style rules flag it as flawed. Chart symptom: handle low undercuts the base midpoint (StockCharts ChartSchool; Fidelity).
- Weak breakout volume. Moves through resistance without visibly stronger volume fizzle more often. Chart symptom: marginal push through the pivot with no volume surge (MarketSmith; Fidelity).
- Throwback then breakdown. Throwbacks to the pivot are common in catalog studies and can roll over. Chart symptom: brief move above resistance, quick return to pivot, then loss of support (Bulkowski).
- V‑shaped “cups.” Sharp, quick reversals lack base‑building and fail more. Chart symptom: steep, symmetric drop‑and‑pop with no saucer (StockCharts ChartSchool).
- Unfavorable market context. Breakouts during broader market corrections fail more. Chart symptom: valid shapes that don’t sustain once indexes turn down. Wikipedia CAN SLIM
How to respond when warning signs appear:
– Re‑check structure. Confirm the handle didn’t sink into the lower half or expand beyond roughly one‑third of the cup’s rise (StockCharts ChartSchool; Fidelity).
– Watch trading volume. A move through resistance with contracting volume argues for caution; many wait for a stronger‑volume close to confirm persistence (MarketSmith).
– Plan the retest. If price throws back to the pivot, decide in advance whether you will hold through the retest with a stop under the handle low or require a rebound before staying in (Bulkowski; Fidelity).
Look‑alikes — quick distinctions
| Pattern | How it differs | Where to read more |
|---|---|---|
| Bull flag | No multi‑week rounded base; a sharp pole followed by a short flag/pennant trading range. Some handles resemble tiny flags—confirm the longer cup. | Bull Flag and Bear Flag |
| Double bottom (W) | Two distinct swing lows separated by a mid‑rally; not a continuous U. Breakout is above the middle peak neckline, not a handle. | Double Top and Double Bottom (M and W patterns) |
| Rounding bottom (saucer) | Saucer‑like base with no handle; breakouts can occur straight from the saucer. | O’Reilly, Chart Your Way to Profits (2010), ch. 11: “cup with handle” as a saucer plus handle. O’Reilly |
Quick checks:
– Flags are brief and form after a sharp pole; cups are multi‑swing and rounded.
– Double bottoms require two clear lows; cups trace a continuous U before the handle.
– A saucer breakout skips the handle; a true cup‑with‑handle adds a final, shallow dip before the pivot (StockCharts ChartSchool; Fidelity).
Tooling note — tracking the pattern in TakeProfit
In TakeProfit there is no built‑in cup‑and‑handle scanner; you draw and measure manually.
Practical steps in the platform:
– Draw structure. Mark left/right rims and the handle peak (your breakout/pivot). If you like early triggers, add a short downward trendline over the handle highs.
– Measure geometry. Check the depth of the cup and the handle formation. The projected target equals the breakout level plus the cup height, per standard chart‑pattern practice.
– Upper‑half test. Add a horizontal midpoint line between the cup bottom and right rim; a valid handle low should hold above that midpoint.
Limitation: TakeProfit documents pattern‑drawing tools but does not document automatic detection for the cup‑and‑handle; users annotate levels by hand (see the platform’s Pattern tools overview for drawing features). TakeProfit Pattern tools
Cup and handle pattern FAQ
Is a cup and handle pattern bullish?
Yes. The cup and handle is classed as a bullish continuation base that completes on an upside move above the handle/right rim, ideally on stronger trading volume (Fidelity; MarketSmith).
What are the rules to identify it?
Look for a U‑shaped cup, a handle in the upper half that lasts at least about a week, handle depth roughly ≤ one‑third of the cup advance, and a break or close above the handle peak on higher volume (StockCharts ChartSchool; Fidelity).
What is an inverted cup and handle?
The bearish mirror: a rounded top (inverted cup) with a right‑side handle. The inverted pattern confirms on a close below the right rim; Bulkowski’s target subtracts the handle height from the right rim low. Bulkowski (inverted)
What’s the target after breakout?
A common guideline adds the cup’s height (right rim to bottom) to the breakout or pivot price to estimate the objective. Treat it as an estimate, not a promise. Investopedia
Which timeframe works best?
Classic O’Neil/Bulkowski bases are multi‑week on weekly stock charts, often 7–65 weeks. Daily and intraday versions exist but are noisier.
Educational use only, not investment advice.
To set precise breakout alerts, see TakeProfit’s Alert trigger criteria. Alert trigger criteria